Free Access
Fig. 18.
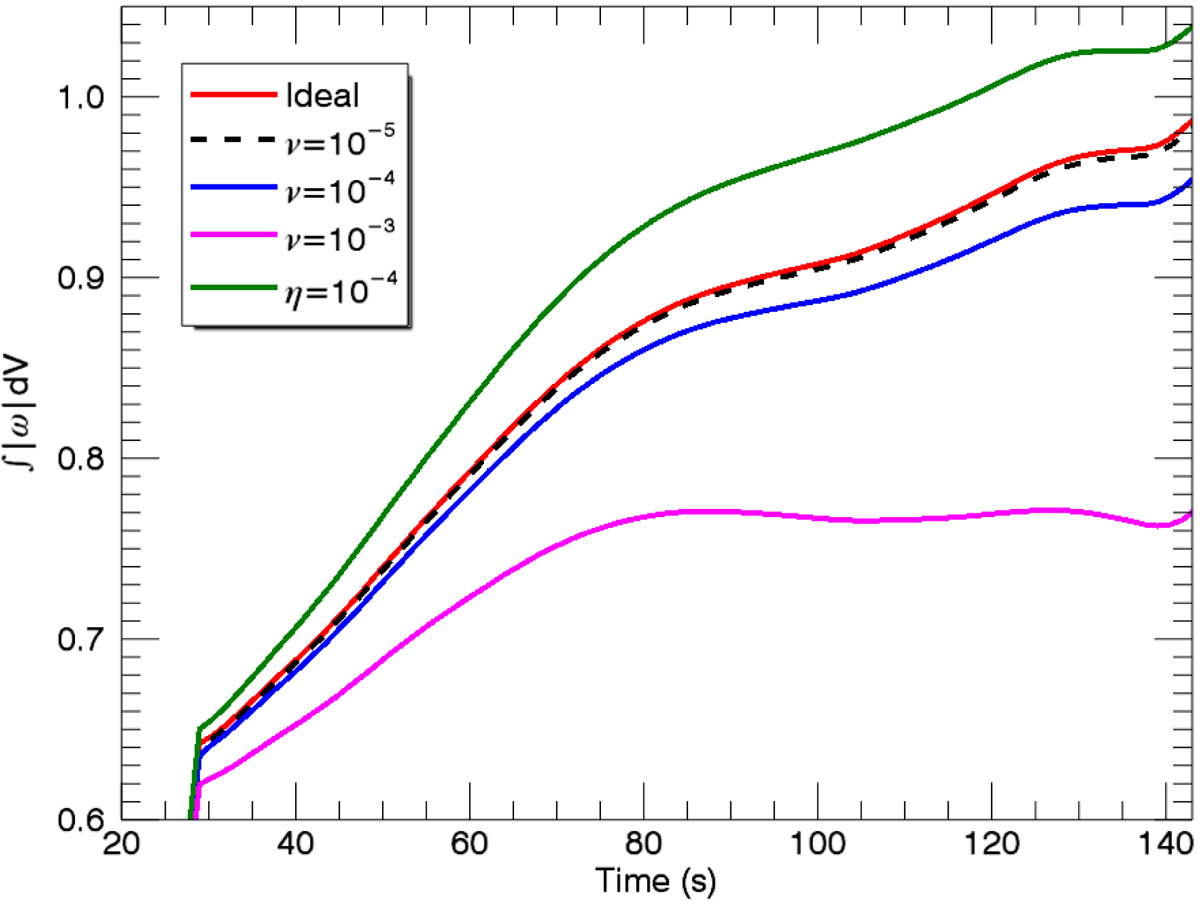
Time evolution of |ω| integrated over the numerical domain for the s5 simulation with different transport coefficients. We note that the early stages of the simulation are omitted here and we have normalised the integral using the maximum value attained in the ideal s5 simulation (as in Fig. 12).
Current usage metrics show cumulative count of Article Views (full-text article views including HTML views, PDF and ePub downloads, according to the available data) and Abstracts Views on Vision4Press platform.
Data correspond to usage on the plateform after 2015. The current usage metrics is available 48-96 hours after online publication and is updated daily on week days.
Initial download of the metrics may take a while.