Free Access
Fig. 12.
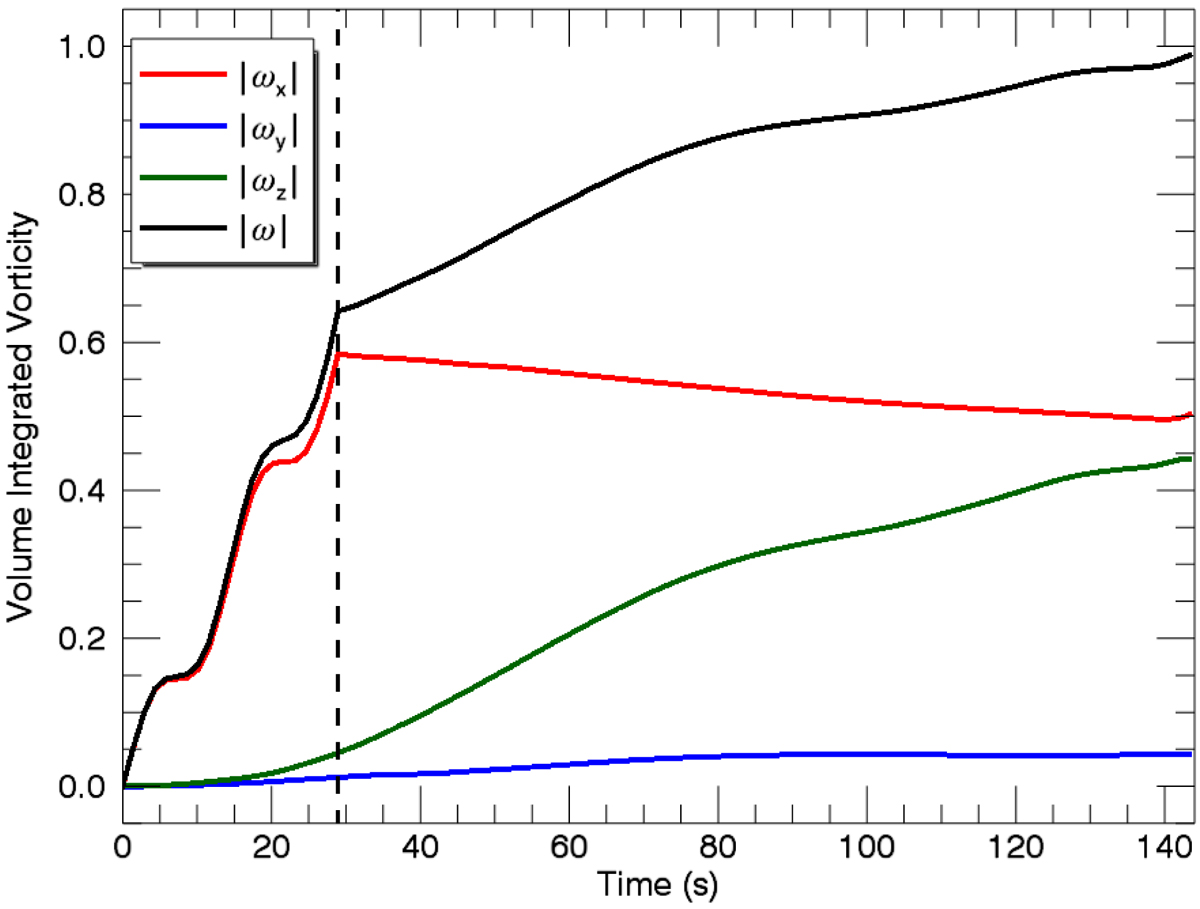
Volume integrated |ω| as a function of time for simulation, s5. Additionally, we display the volume integral of the magnitude of each component and the dashed black line corresponds to the time t = τ when the wave driving ceases.
Current usage metrics show cumulative count of Article Views (full-text article views including HTML views, PDF and ePub downloads, according to the available data) and Abstracts Views on Vision4Press platform.
Data correspond to usage on the plateform after 2015. The current usage metrics is available 48-96 hours after online publication and is updated daily on week days.
Initial download of the metrics may take a while.