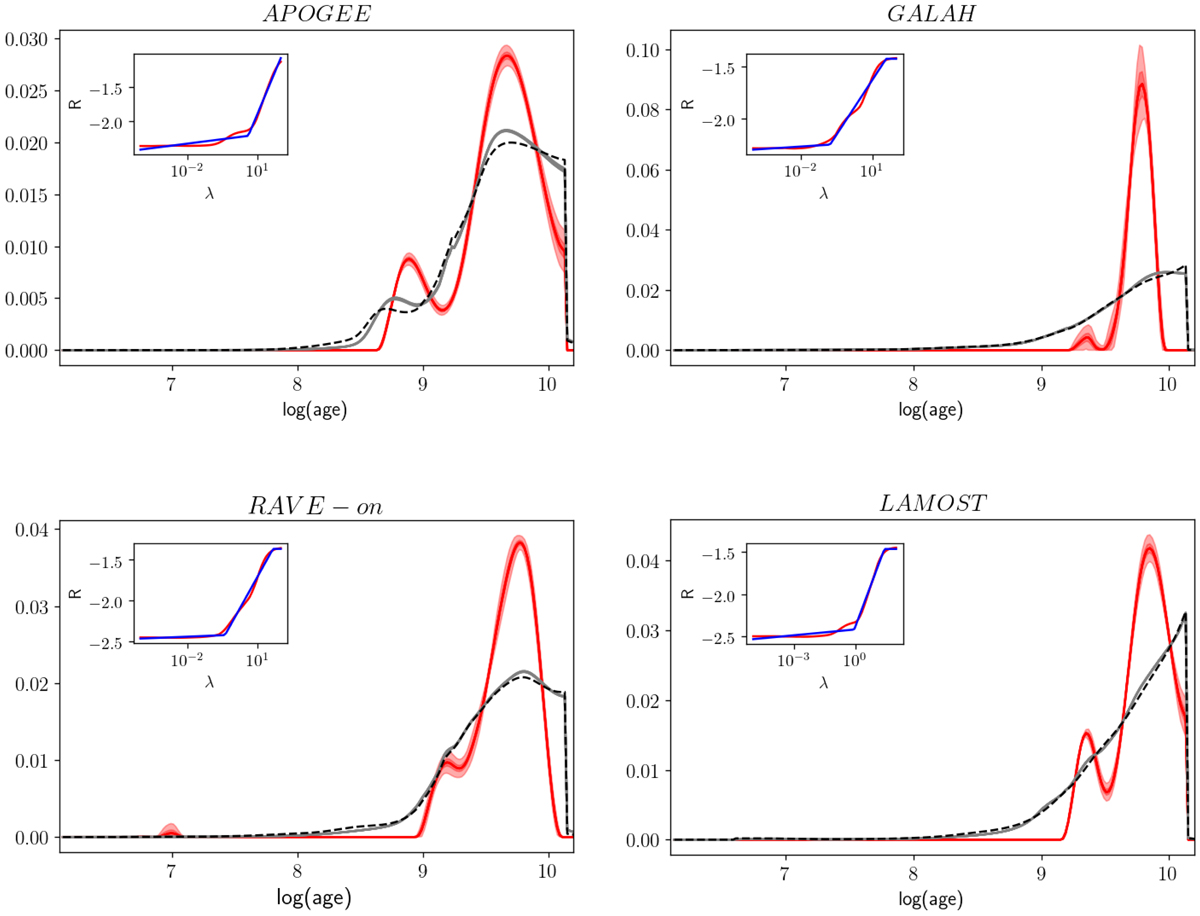
Fig. 9.

Results of age inversion for several surveys. The solid red line is the computed underlying age distribution with 68- (dark shading) and 95 (light shading) percent confidence intervals. Input log(age) PDFs for five parts of each survey are plotted with grey lines and the black dashed line shows the log(age) PDF inferred from the inversion result. The inset in each panel shows the cross-validation curves (red) and piecewise-linear fit (blue) for one part of the survey (see Sect. 3.3 for the description of the cross-validation curve).
Current usage metrics show cumulative count of Article Views (full-text article views including HTML views, PDF and ePub downloads, according to the available data) and Abstracts Views on Vision4Press platform.
Data correspond to usage on the plateform after 2015. The current usage metrics is available 48-96 hours after online publication and is updated daily on week days.
Initial download of the metrics may take a while.


