Fig. B.1.
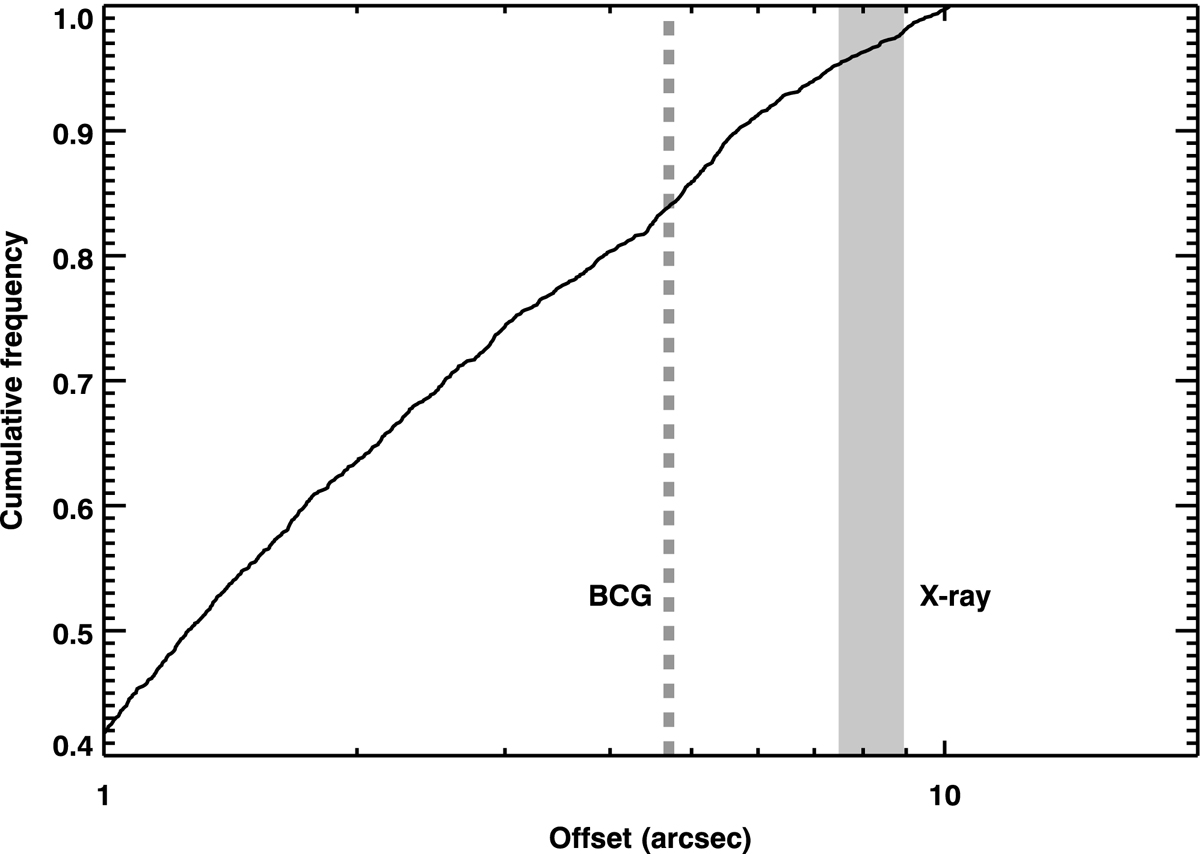
Cumulative distributions of the positional offset between the true and recovered peak of the SZ signal. These are based on Monte Carlo simulations using the (u, v) sampling of the data visibilities, assuming a noise consistent with the observed one and using a Arnaud et al. (2010) pressure model with a total mass of 6 × 10¹³M⊙. The grey band (dashed vertical line) shows the offset between the positions of the SZ and X-ray peaks (respectively, BCG).
Current usage metrics show cumulative count of Article Views (full-text article views including HTML views, PDF and ePub downloads, according to the available data) and Abstracts Views on Vision4Press platform.
Data correspond to usage on the plateform after 2015. The current usage metrics is available 48-96 hours after online publication and is updated daily on week days.
Initial download of the metrics may take a while.