Free Access
Fig. 5.
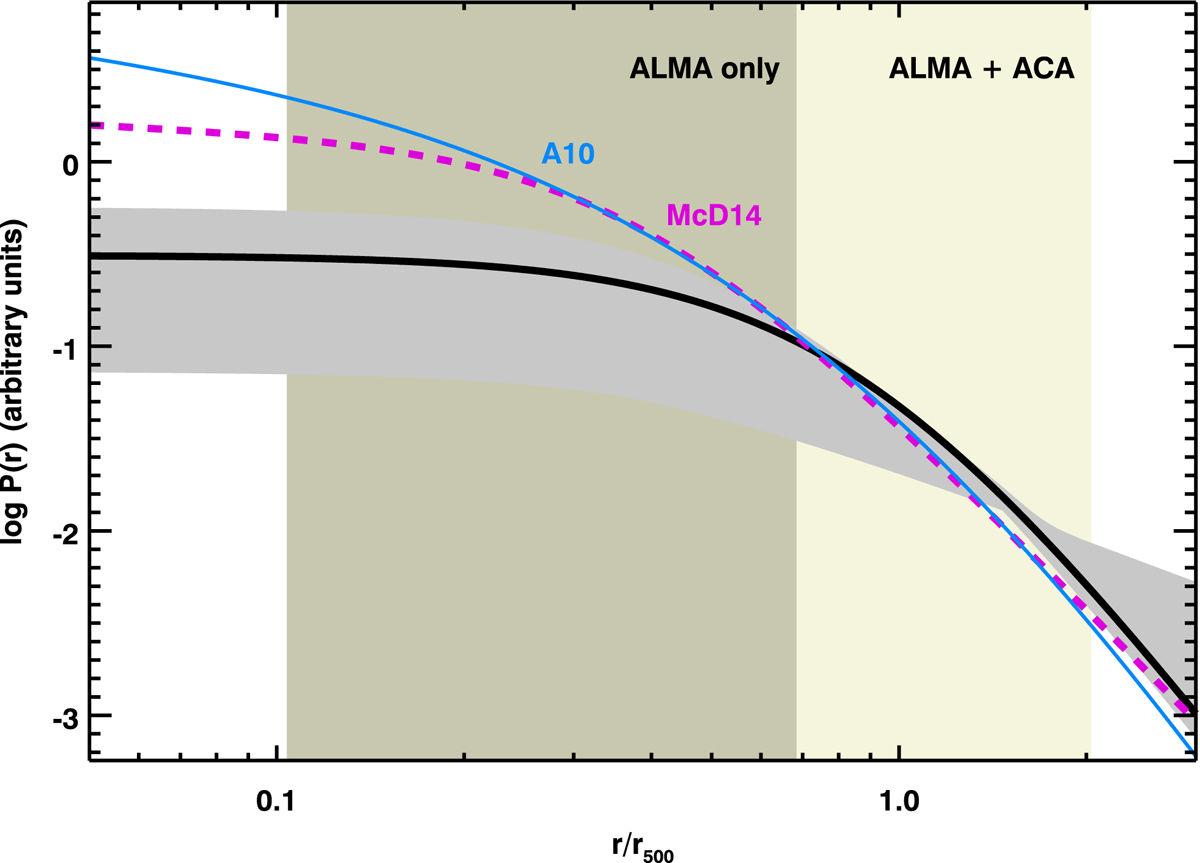
Best-fit β model (black curve) and 1σ confidence envelope (grey). For comparison, the A10 and average McD14 models are shown in blue and magenta, respectively, and the spatial ranges probed by ALMA and ACA are shown by light and dark tan regions.
Current usage metrics show cumulative count of Article Views (full-text article views including HTML views, PDF and ePub downloads, according to the available data) and Abstracts Views on Vision4Press platform.
Data correspond to usage on the plateform after 2015. The current usage metrics is available 48-96 hours after online publication and is updated daily on week days.
Initial download of the metrics may take a while.