Free Access
Fig. 4.
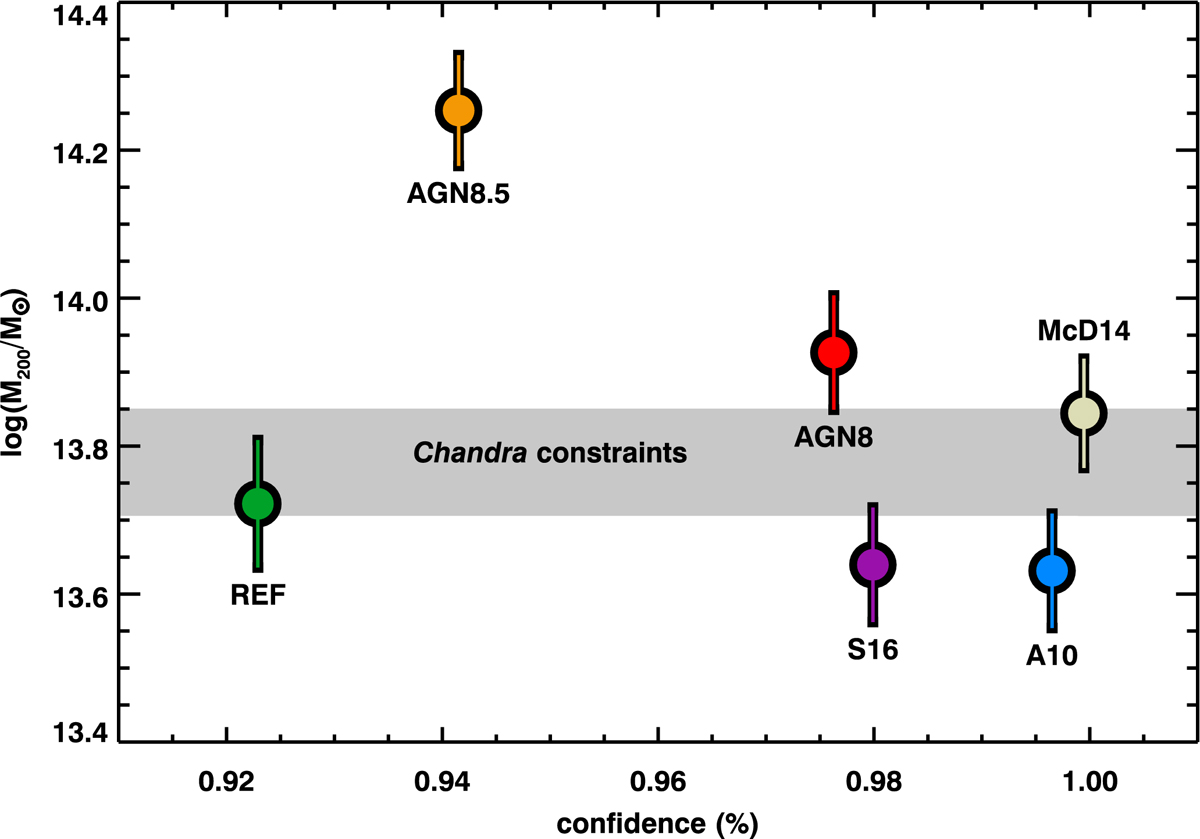
Total mass constraints obtained from fitting the observed uv-amplitude profile with theoretical and empirical models (Fig. 3A), as a function of the confidence of the fit derived from the χ2. The grey horizontal stripe shows the 1σ Chandra mass constraint, for comparison.
Current usage metrics show cumulative count of Article Views (full-text article views including HTML views, PDF and ePub downloads, according to the available data) and Abstracts Views on Vision4Press platform.
Data correspond to usage on the plateform after 2015. The current usage metrics is available 48-96 hours after online publication and is updated daily on week days.
Initial download of the metrics may take a while.