Fig. 2.
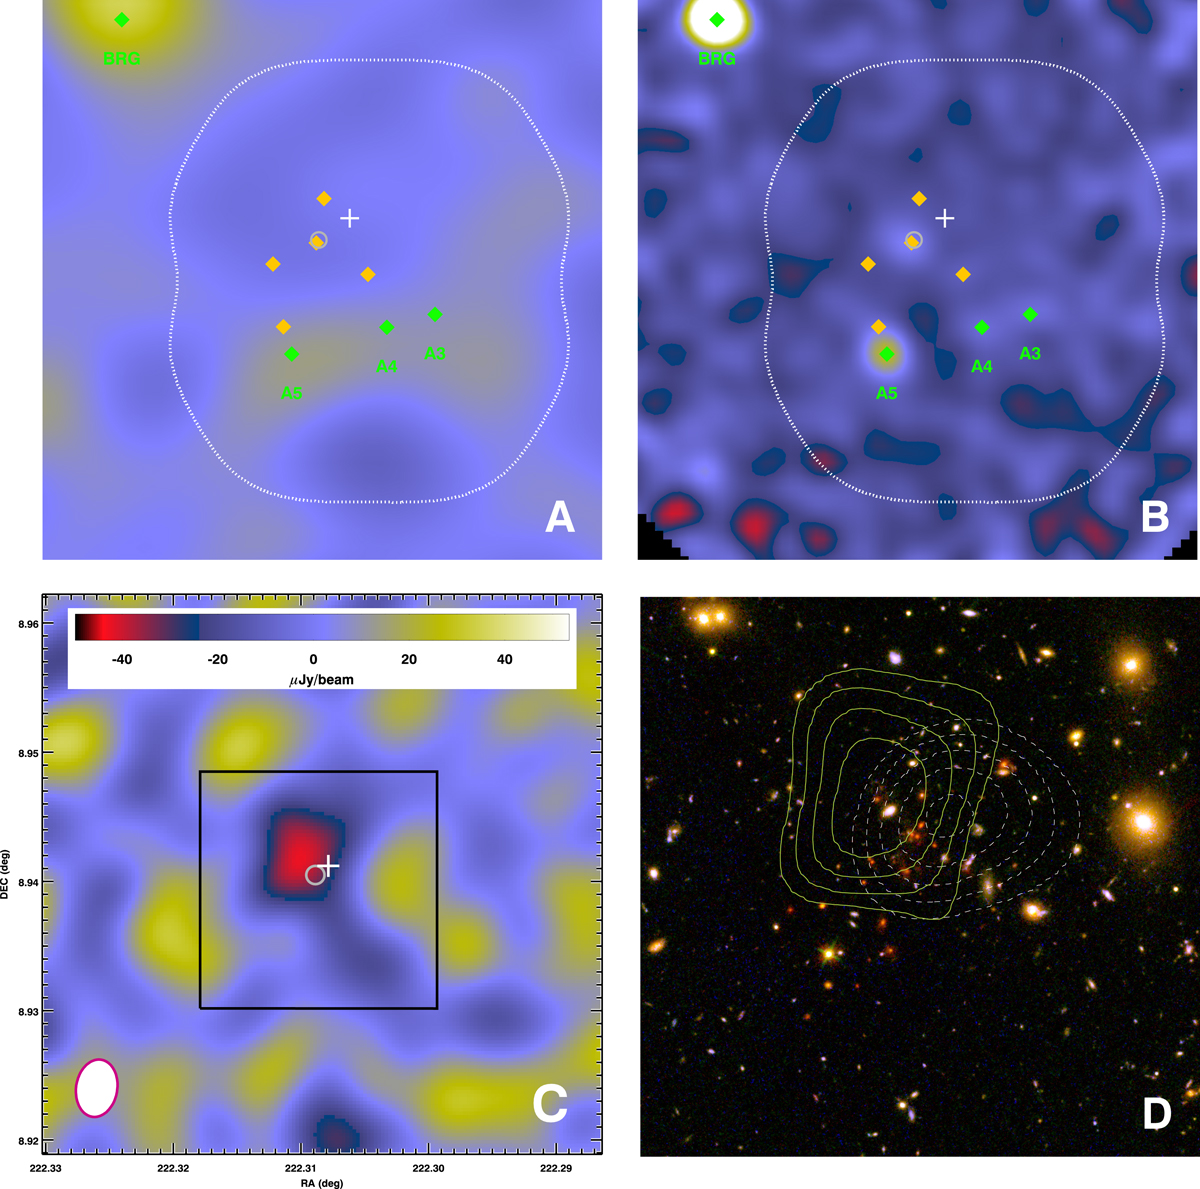
92 GHz images of Cl1449 before and after subtracting point sources. Top: ACA (A) and ALMA (B) 92 GHz maps of the field of Cl1449 before point-source subtraction, created from the data using the CASA routine CLEAN. The white cross marks the centroid position of the extended X-ray emission seen by Chandra while the grey circle shows the positions of the still-forming central galaxy of the cluster. The positions of all subtracted point sources are shown by diamonds (orange for confirmed cluster members, green with labels for confirmed or possible interlopers). For comparison, the dotted white contour marks the extent of the ALMA observations described in C18 and S18. Bottom: combined ACA+ALMA 92 GHz image after subtracting point sources (C), showing the SZ signal from the cluster’s ICM. The black square shows the field of view of panels A, B, and D, and the white-filled magenta ellipse shows the average synthesised beam size. Panel D: HST/WFC3 colour composite (F105W, F140W, and F160W) image of Cl1449 for comparison. The dashed grey contours display the X-ray emission as seen by Chandra, while the light green contours show the SZ signal above the rms noise.
Current usage metrics show cumulative count of Article Views (full-text article views including HTML views, PDF and ePub downloads, according to the available data) and Abstracts Views on Vision4Press platform.
Data correspond to usage on the plateform after 2015. The current usage metrics is available 48-96 hours after online publication and is updated daily on week days.
Initial download of the metrics may take a while.