Fig. E.1.
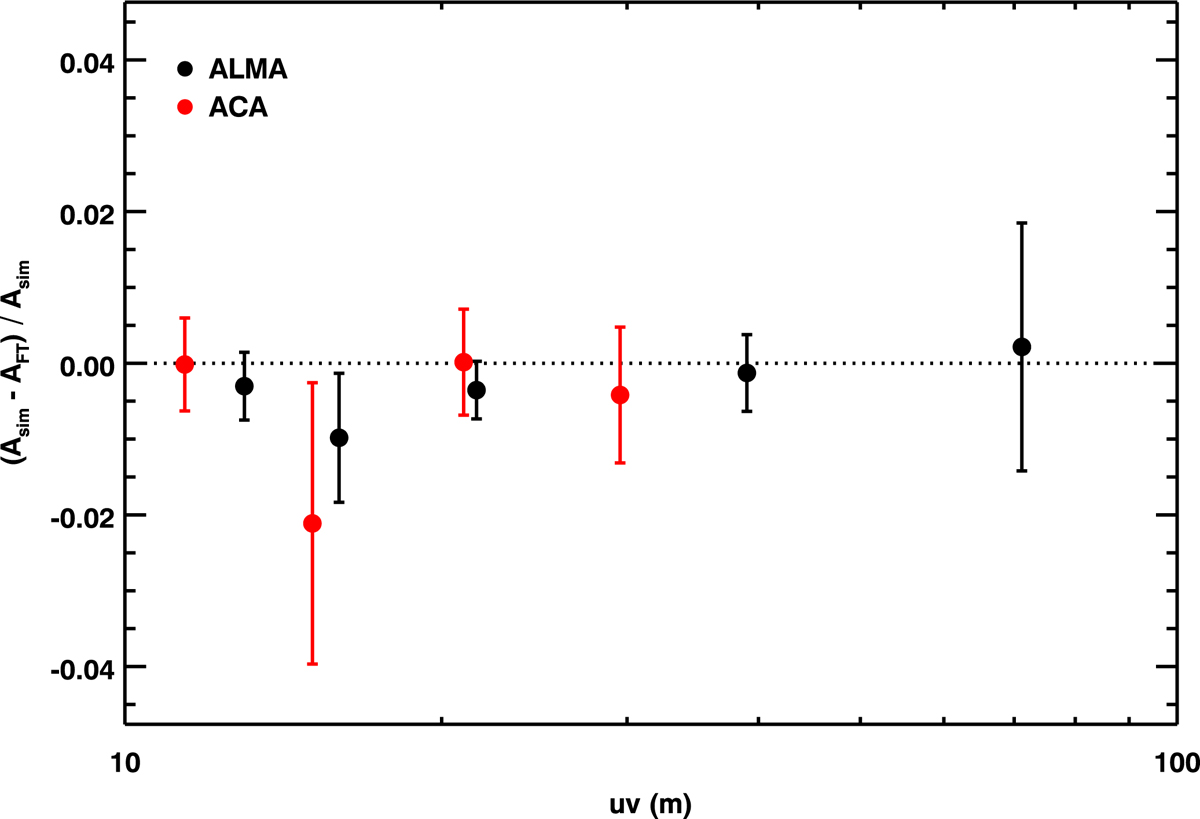
Relative amplitude difference, as a function of uv-distance, between the output of noise-free simulated observations of parametric models (see main text) done with the simalma task of the CASA software and simpler Fourier transforms of the same models (with primary beam attenuation) interpolated at the same (u,v) coordinates. The error bars show the rms deviations between model visibilities computed with both methods.
Current usage metrics show cumulative count of Article Views (full-text article views including HTML views, PDF and ePub downloads, according to the available data) and Abstracts Views on Vision4Press platform.
Data correspond to usage on the plateform after 2015. The current usage metrics is available 48-96 hours after online publication and is updated daily on week days.
Initial download of the metrics may take a while.