Fig. 1.
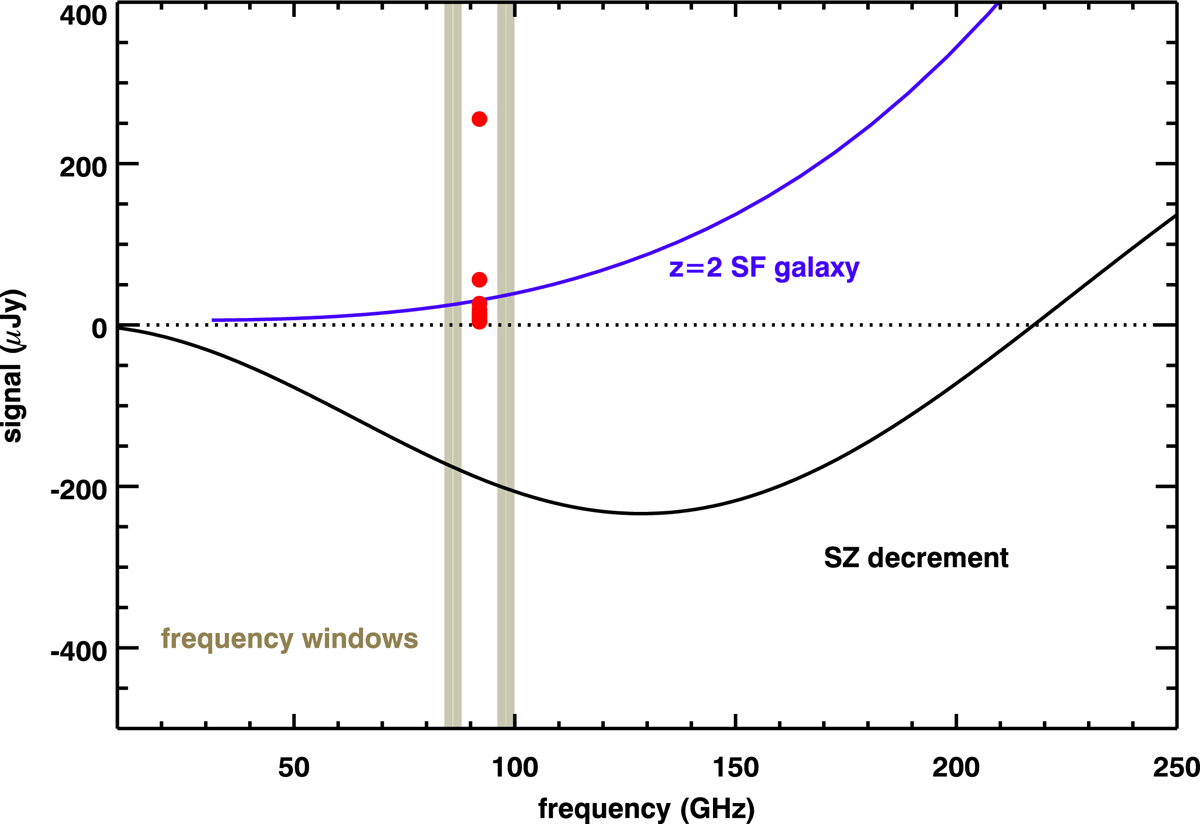
Sunyaev-Zel’dovich decrement as a function of frequency, scaled to our observed 92 GHz value (see Sect. 3), with a MS SED at z = 2 for comparison (blue curve; Magdis et al. 2012). The red dots show the 92 GHz fluxes of point sources within the field of Cl1449, while the dark tan bands mark the frequency windows of our observations (lower and upper sub-band, respectively).
Current usage metrics show cumulative count of Article Views (full-text article views including HTML views, PDF and ePub downloads, according to the available data) and Abstracts Views on Vision4Press platform.
Data correspond to usage on the plateform after 2015. The current usage metrics is available 48-96 hours after online publication and is updated daily on week days.
Initial download of the metrics may take a while.