Fig. 5
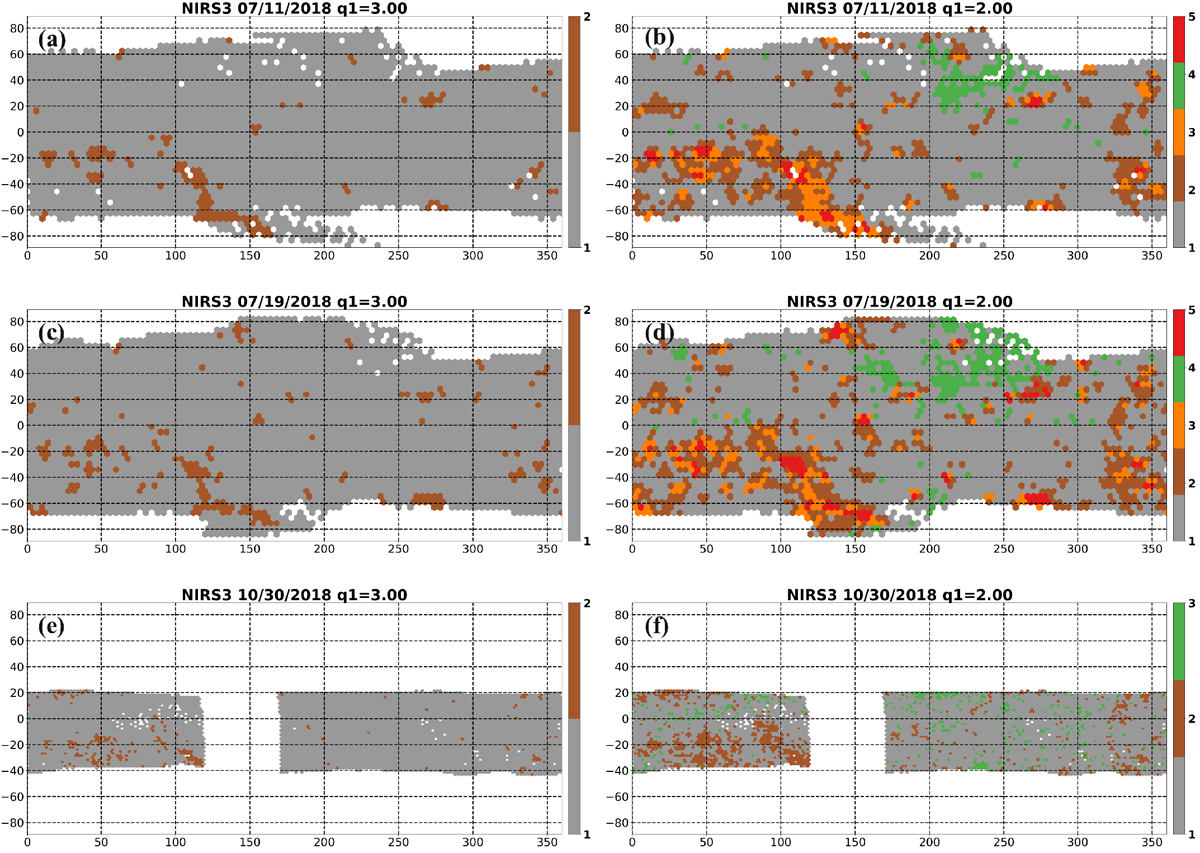
Distribution of groups identified by analysis of NIRS3 data on cylindrical projection maps. Left panels: distribution of the two groups obtained at 3σ confidence level; right panels: distribution of the various groups obtained at 2σ confidence level. Distribution maps of the groups obtained for July 11, 2018 are in (a) and (b); (c) and (d) are the distribution maps of the groups obtained for July 19, 2018; and (e) and (f) are the distribution maps of the groups obtained for October 30, 2018. The spatial resolutions are 40, 20, and less than 10 m px−1, respectively. Group #4 reported in green in panels b and d could be affected by uncertainties of thermal correction.
Current usage metrics show cumulative count of Article Views (full-text article views including HTML views, PDF and ePub downloads, according to the available data) and Abstracts Views on Vision4Press platform.
Data correspond to usage on the plateform after 2015. The current usage metrics is available 48-96 hours after online publication and is updated daily on week days.
Initial download of the metrics may take a while.