Fig. A.1
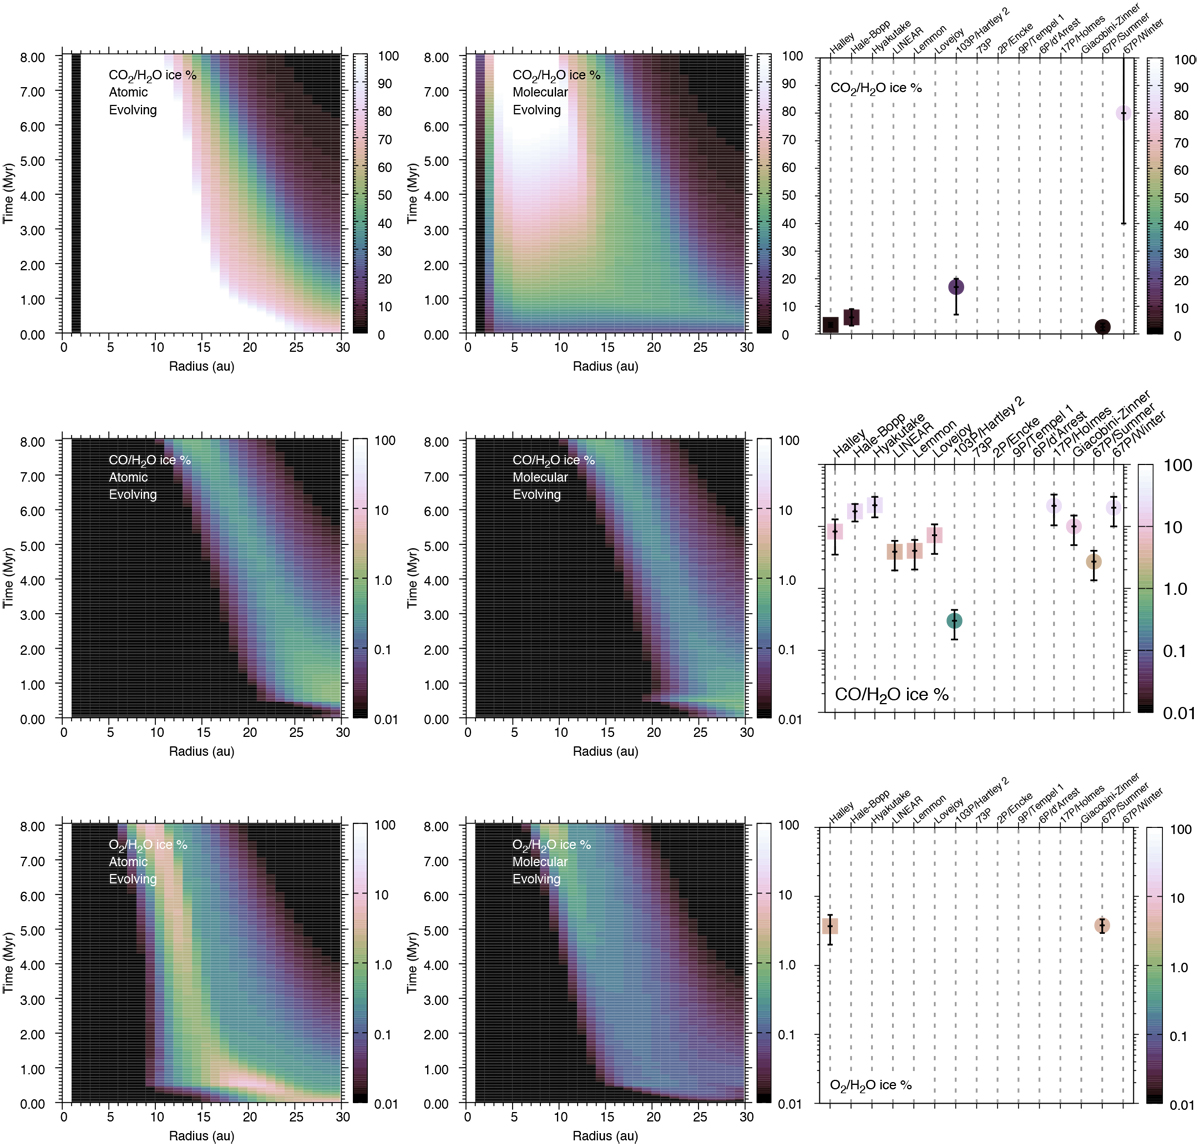
Abundance of CO2, CO, and O2 ice relative to water ice as a function of radius and time for the protoplanetary disk model with evolving physical conditions and using fully atomic initial abundances (left) and fully molecular initial abundances (middle). Note that the data for CO2 are shown on a linear scale as opposed to logarithmic because of the low dynamic range in the chemical model results. The right-hand column shows the corresponding values measured for each species in cometary comae. The vertical dashed lines are included solely to guide the eye. Oort cloud comets and Jupiter family comets are represented by the squares and circles, respectively. For comets without a stated observed error (or range), we have assumed a conservative error of 50% of the observed ratio with respect to H2O ice.
Current usage metrics show cumulative count of Article Views (full-text article views including HTML views, PDF and ePub downloads, according to the available data) and Abstracts Views on Vision4Press platform.
Data correspond to usage on the plateform after 2015. The current usage metrics is available 48-96 hours after online publication and is updated daily on week days.
Initial download of the metrics may take a while.