Fig. 3
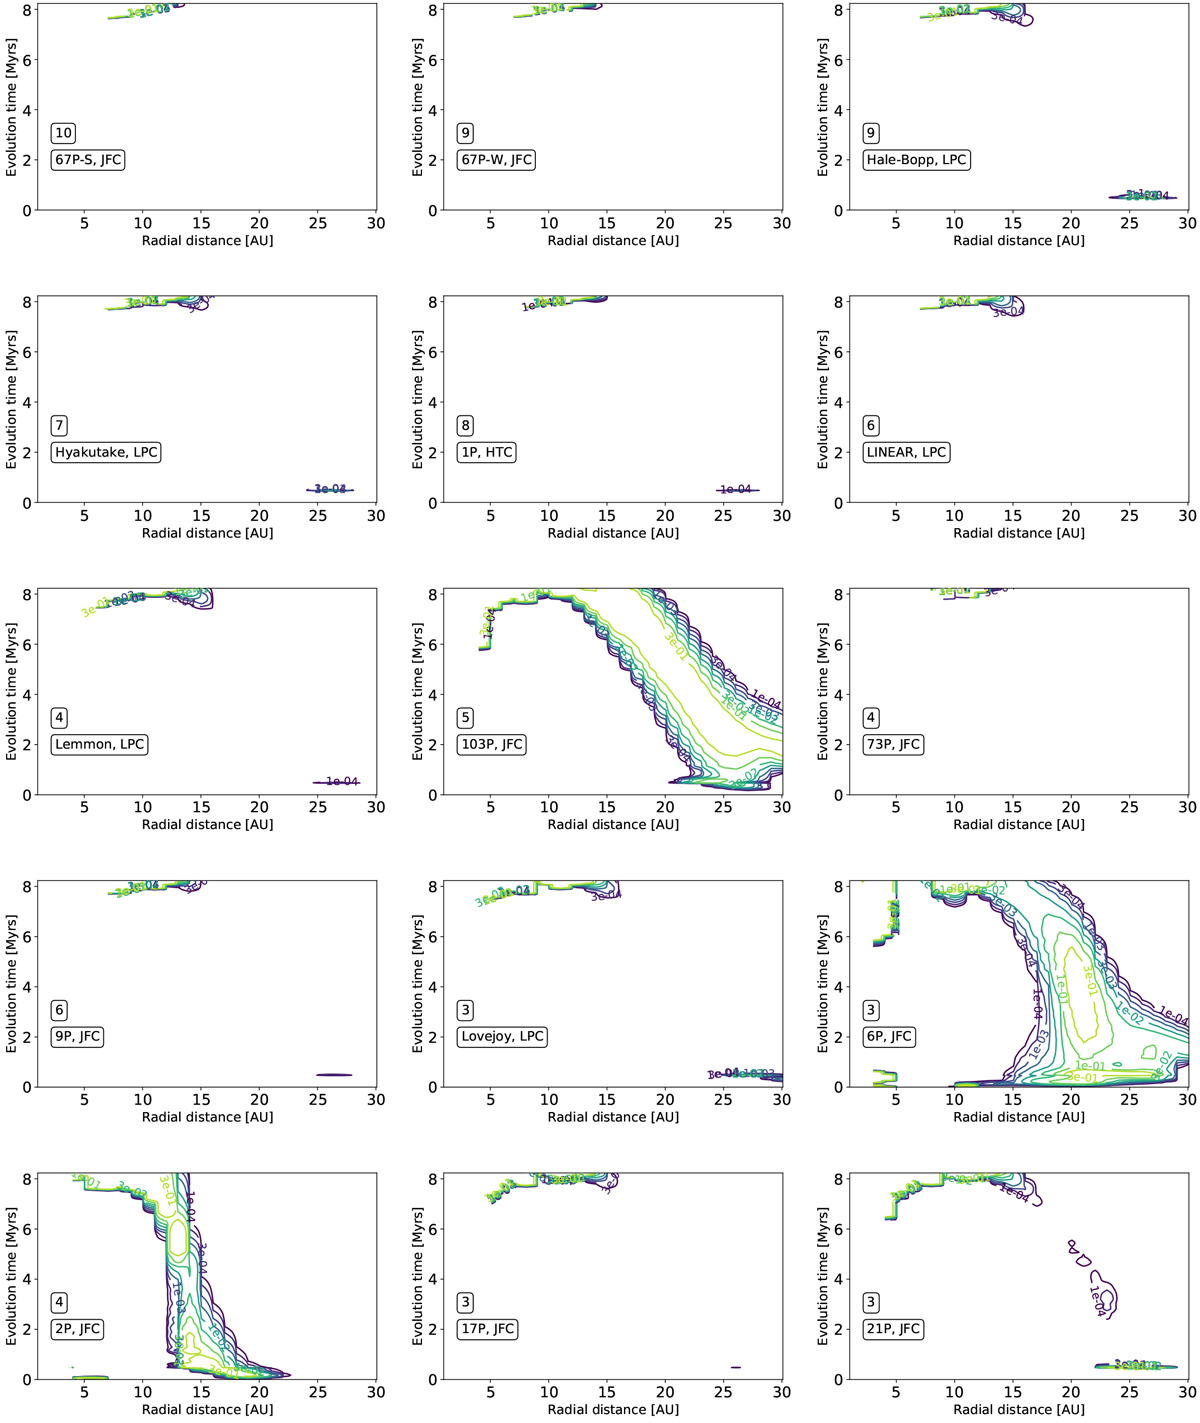
Maximum likelihood surfaces for inheritance scenario, for full sample of molecular species. The maximum likelihood increases from dark purple contours to light green contours. Darkest purple contour represents maximum likelihood of 10−4, and increases with each lighter contour level to 3 × 10⁻⁴, 10−3, 3 × 10⁻³, 10−2, 3 × 10⁻², 10−1, and finally 3 × 10⁻¹ for the lightest green contour. Radius in AU in the physically evolving protoplanetary disk midplane is on the x-axis, and evolution time in Myrs is on the y-axis.
Current usage metrics show cumulative count of Article Views (full-text article views including HTML views, PDF and ePub downloads, according to the available data) and Abstracts Views on Vision4Press platform.
Data correspond to usage on the plateform after 2015. The current usage metrics is available 48-96 hours after online publication and is updated daily on week days.
Initial download of the metrics may take a while.