Fig. 1
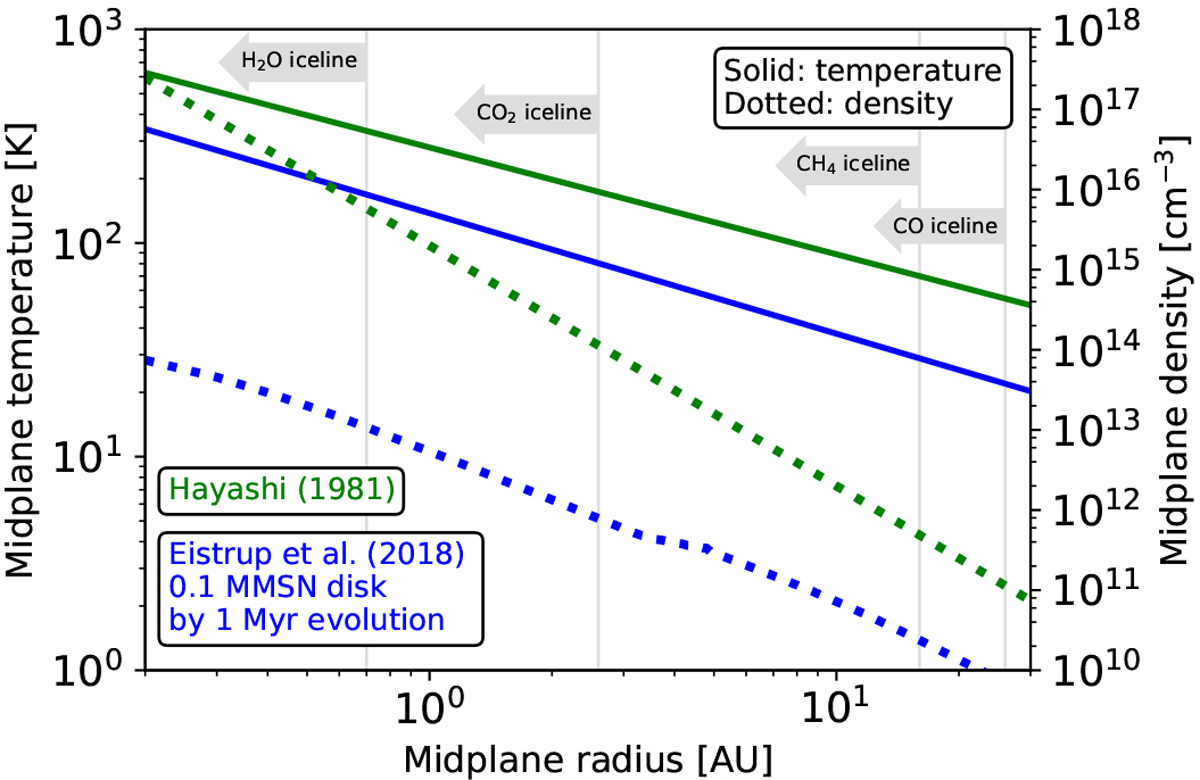
Physical structures of disk midplanes for pre-solar nebula from Hayashi (1981; in green), and for 0.1 MMSN disk by 1 Myr evolution from Eistrup et al. (2018; in blue). Solid profiles are for temperature. Dotted profiles are for number density. The vertical grey lines indicate the positions of the icelines of H2O, CO2, CH4 and CO by 1 Myr evolution for the 0.1 MMSN disk in Eistrup et al. (2018). The grey arrows on each of the vertical lines indicate which species each line is associated with, and how the iceline moves over time (all inwards).
Current usage metrics show cumulative count of Article Views (full-text article views including HTML views, PDF and ePub downloads, according to the available data) and Abstracts Views on Vision4Press platform.
Data correspond to usage on the plateform after 2015. The current usage metrics is available 48-96 hours after online publication and is updated daily on week days.
Initial download of the metrics may take a while.