Fig. 5.
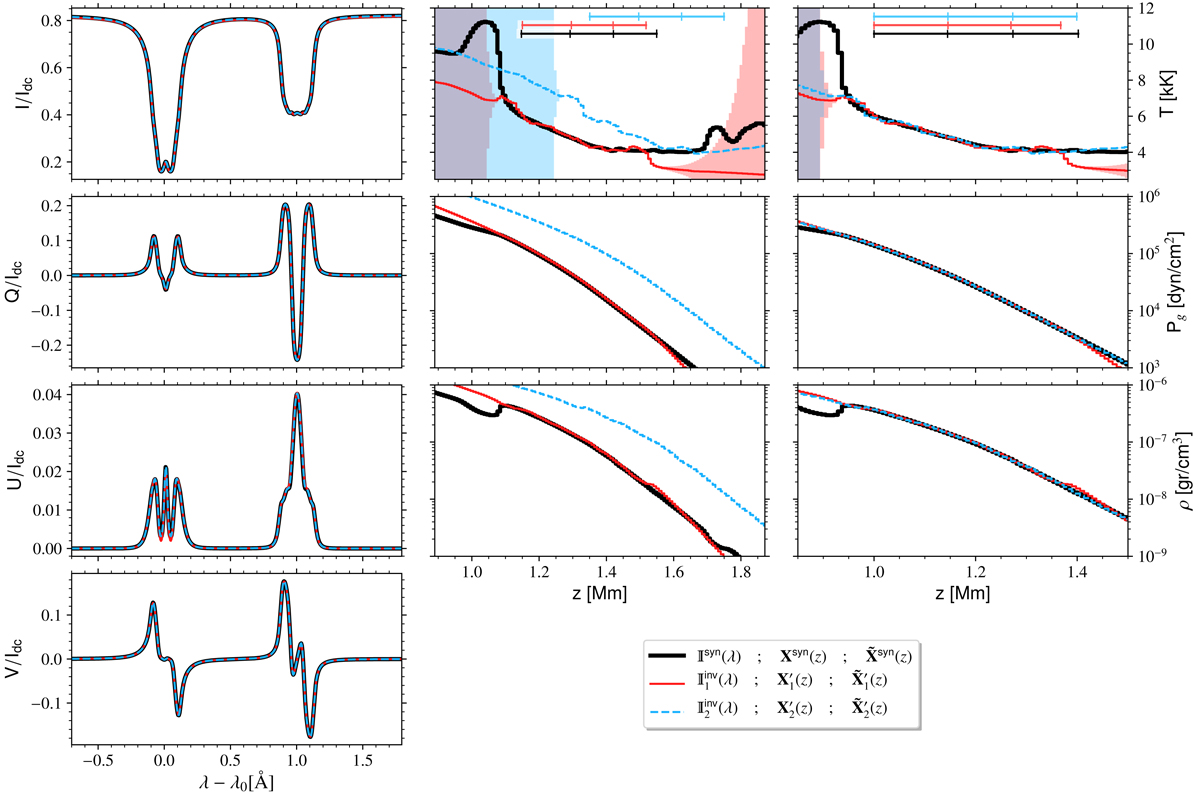
Inversion of Stokes profiles in hydrostatic equilibrium for different values of the gas pressure top boundary condition, Pg(zmax = 2048 km). Left column: Stokes parameters, from top to bottom, I, Q, U, and V, for the simulated case, 𝕀syn(λ) (solid-black lines), the inversion with ![]() dyn cm−2 (
dyn cm−2 (![]() , solid red lines) and the inversion with
, solid red lines) and the inversion with ![]() dyn cm−2 (
dyn cm−2 (![]() , dash blue lines). Middle column: thermodynamic parameters used for the simulated data (Xsyn(z)) together with the ones obtained for each inversion (
, dash blue lines). Middle column: thermodynamic parameters used for the simulated data (Xsyn(z)) together with the ones obtained for each inversion (![]() and
and ![]() , following the same color code). Right column: same thermodynamic parameters (
, following the same color code). Right column: same thermodynamic parameters (![]() ,
, ![]() , and
, and ![]() ), but setting a common height origin for the three cases h(τ5 = 1)=1000 km. In the upper-center and -right panels we include horizontal lines with ticks for, from left to right, the heights at which lgτ5 = 0, −1, −2, −3 for each atmosphere (following the same color code).
), but setting a common height origin for the three cases h(τ5 = 1)=1000 km. In the upper-center and -right panels we include horizontal lines with ticks for, from left to right, the heights at which lgτ5 = 0, −1, −2, −3 for each atmosphere (following the same color code).
Current usage metrics show cumulative count of Article Views (full-text article views including HTML views, PDF and ePub downloads, according to the available data) and Abstracts Views on Vision4Press platform.
Data correspond to usage on the plateform after 2015. The current usage metrics is available 48-96 hours after online publication and is updated daily on week days.
Initial download of the metrics may take a while.