Fig. 9
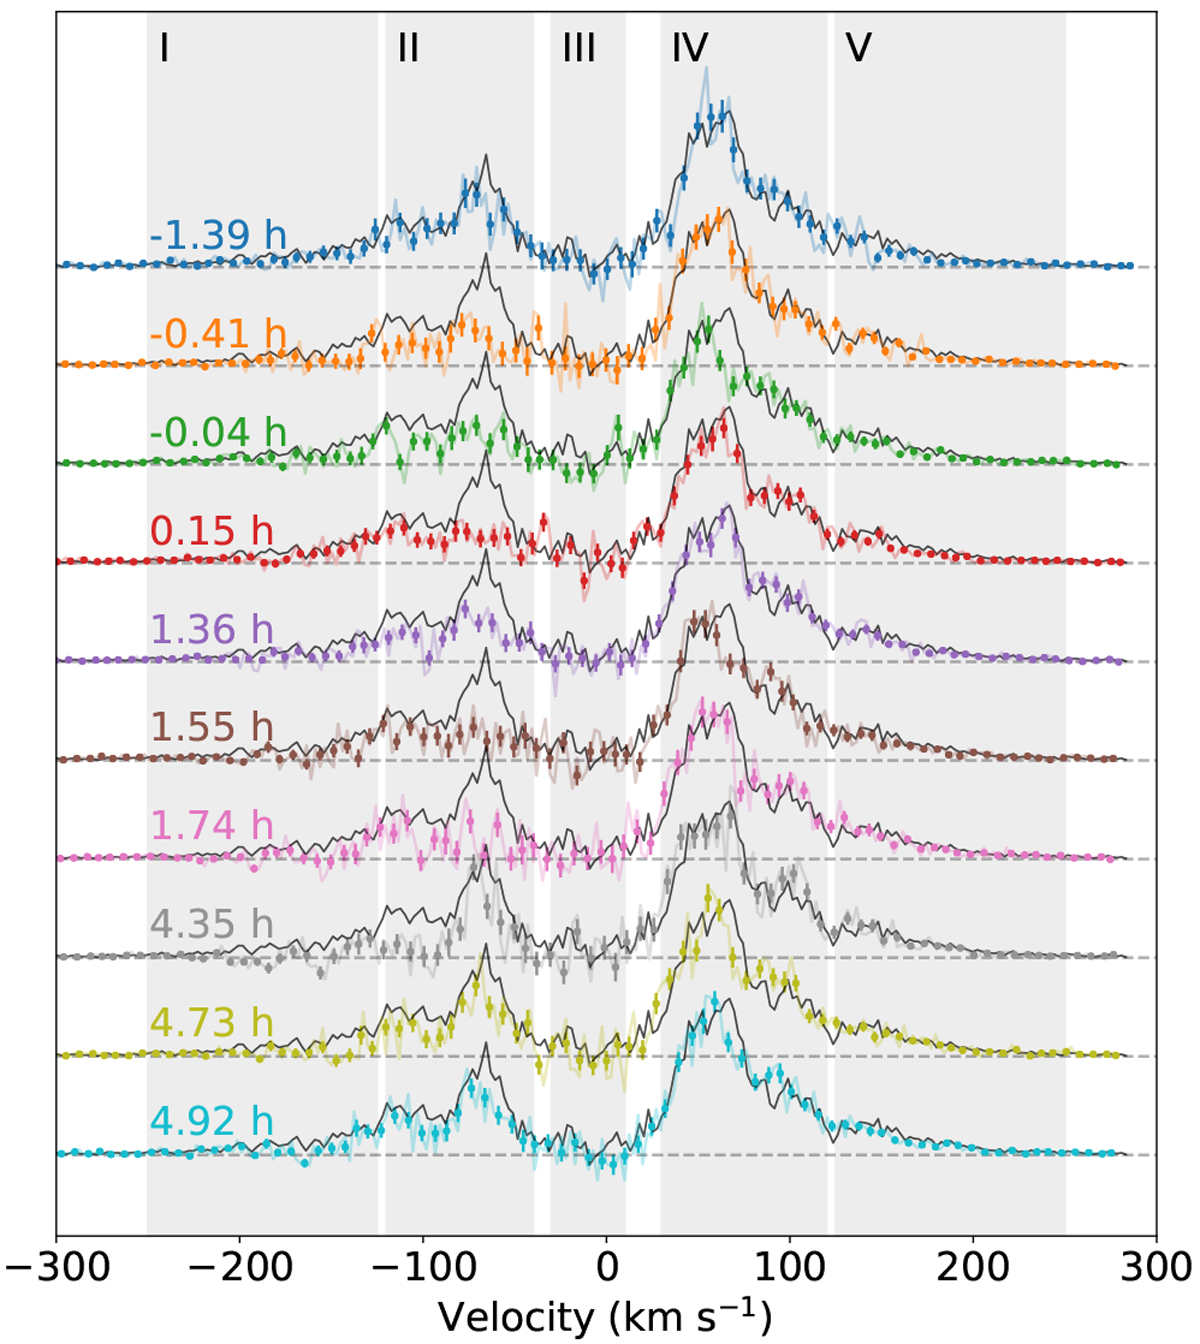
HST-COS Lyman-α profiles of GJ 436 observed during Visit D after airglow decontamination (color spectra), binned to Doppler velocity intervals of 7km s−1. The reference out-of-transit spectrum is plotted for comparison as a black spectrum against each exposure of Visit D. The regions shaded in gray correspond to: I) the reference far blue wing [−250, −120] km s−1; II) the blue wing [−120, −40] km s−1; III) the line core absorbed by the ISM [−30, +10] km s−1; IV) the red wing [+30, +120] km s−1; V) the reference far red wing [+120, +250] km s−1. We do notexpect planetary signals in regions I and V, so they can be used to estimate the stability of the Lyman-α emission. The timestamps correspond to the phases in relation to the orbital motion of the planet.
Current usage metrics show cumulative count of Article Views (full-text article views including HTML views, PDF and ePub downloads, according to the available data) and Abstracts Views on Vision4Press platform.
Data correspond to usage on the plateform after 2015. The current usage metrics is available 48-96 hours after online publication and is updated daily on week days.
Initial download of the metrics may take a while.