Fig. 8
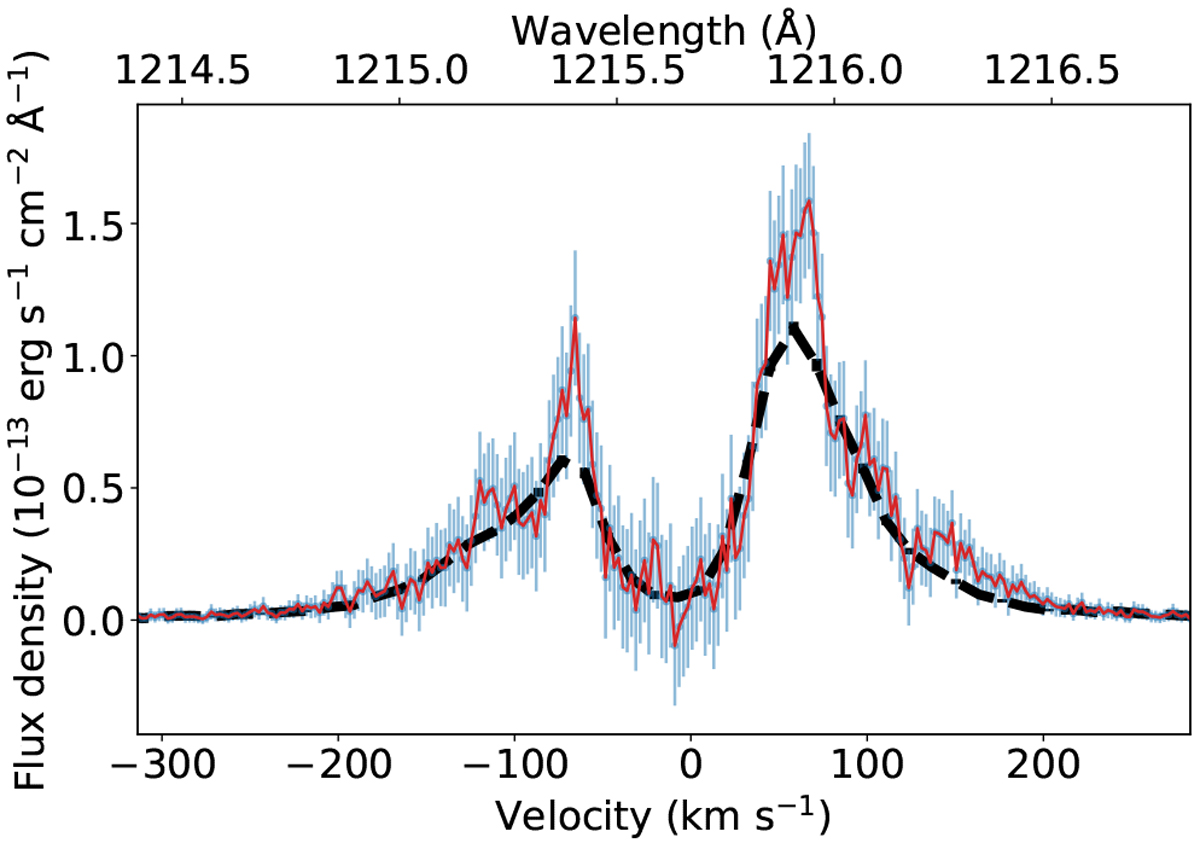
Mean out-of-transit Lyman-α spectrum of GJ 436 measured with HST-COS observations from program GO-15174 (red spectrum with blue uncertainty bars). For comparison, we plot the mean out-of-transit spectrum measured with HST-STIS in black. The spectra are centered in the stellar rest frame. The intrinsic Lyman-α emission line of GJ 436 likely possesses a single-peaked Voigt shape (Bourrier et al. 2015), but the core of the line is absorbed bythe ISM, producing a double-peaked feature when observed from the Earth.
Current usage metrics show cumulative count of Article Views (full-text article views including HTML views, PDF and ePub downloads, according to the available data) and Abstracts Views on Vision4Press platform.
Data correspond to usage on the plateform after 2015. The current usage metrics is available 48-96 hours after online publication and is updated daily on week days.
Initial download of the metrics may take a while.