Free Access
Fig. 2
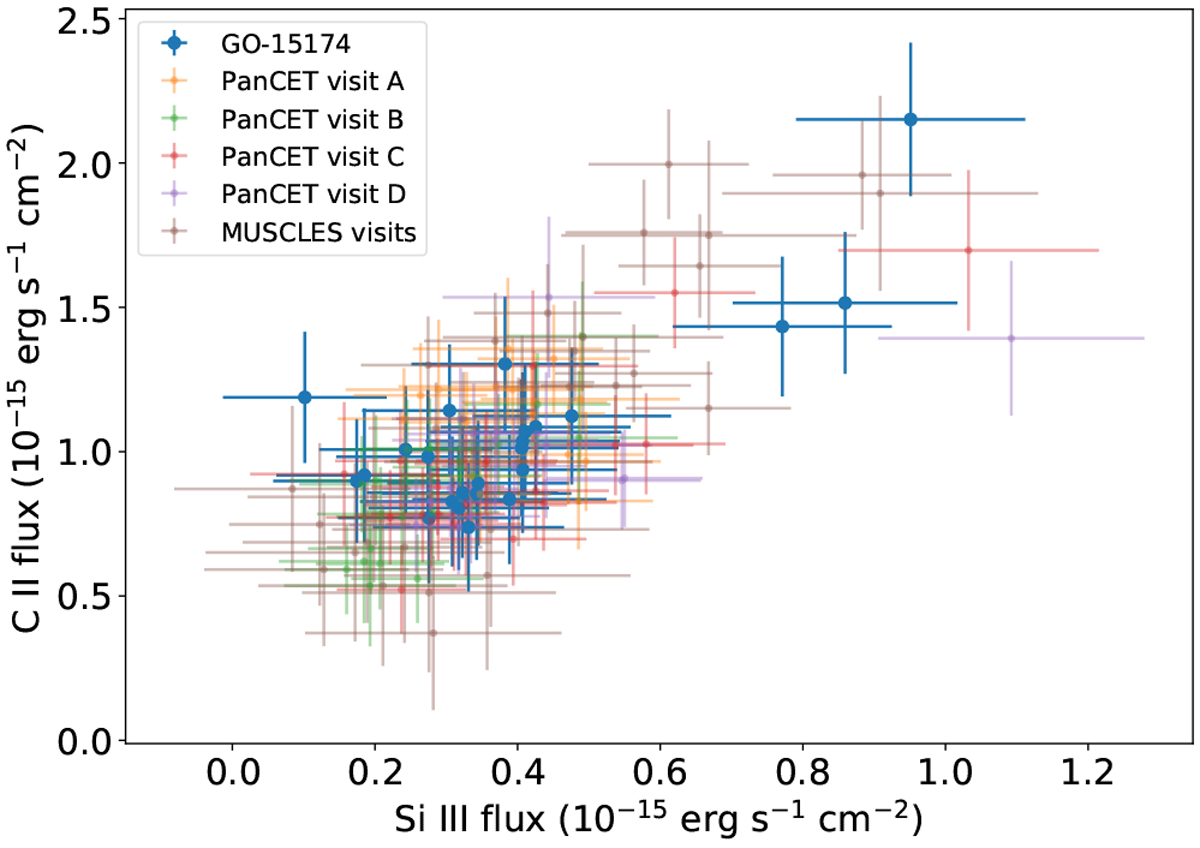
Fluxes of Si III versus C II lines in spectra of GJ 436. The strong correlation (Pearson-r > 0.7) between these fluxes leads us to conclude that the higher flux end of the plot corresponds to stellar flares, while the lower flux end corresponds to the quiescent state of the star.
Current usage metrics show cumulative count of Article Views (full-text article views including HTML views, PDF and ePub downloads, according to the available data) and Abstracts Views on Vision4Press platform.
Data correspond to usage on the plateform after 2015. The current usage metrics is available 48-96 hours after online publication and is updated daily on week days.
Initial download of the metrics may take a while.