Free Access
Fig. 14
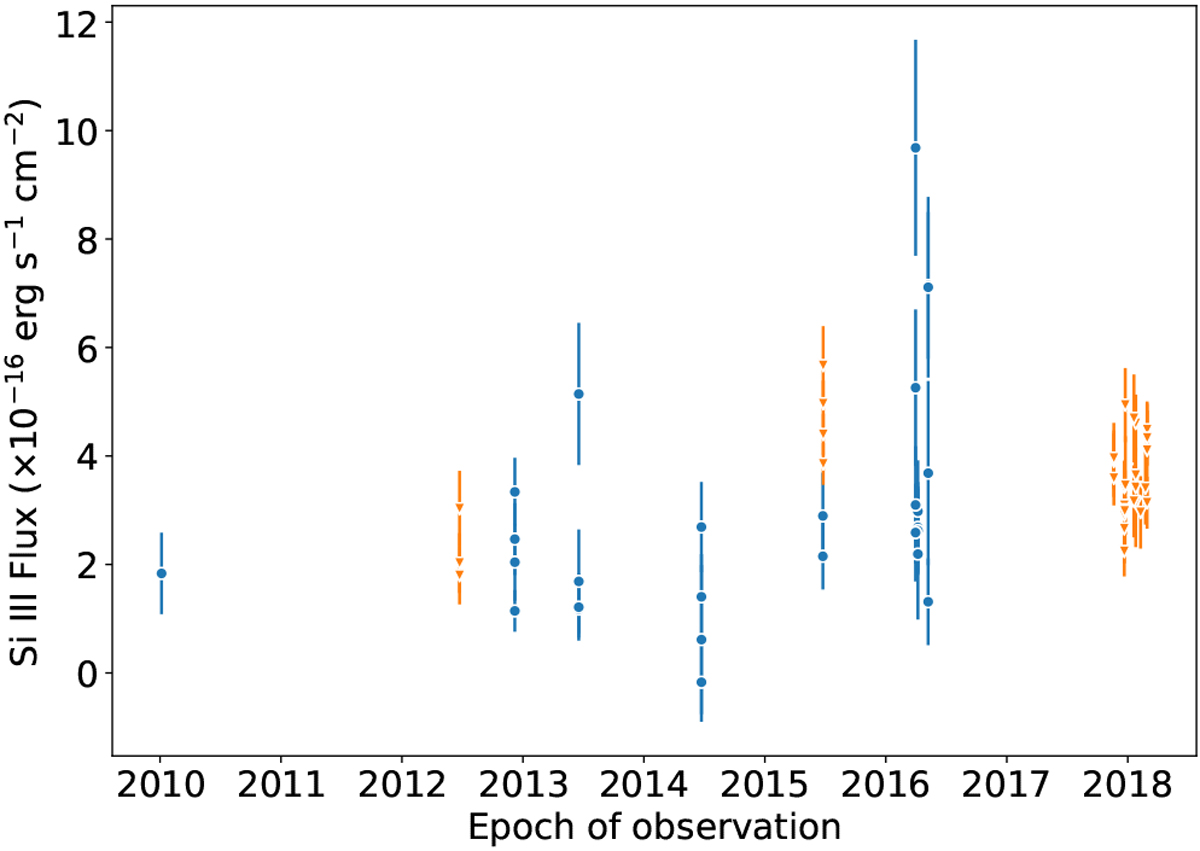
Stellar Si III fluxes of GJ 436 measured with STIS and COS spectrographs on HST across different epochs. The average fluxand variability of the line seem to have increased since 2015, which can be related to the stellar activity cycle.
Current usage metrics show cumulative count of Article Views (full-text article views including HTML views, PDF and ePub downloads, according to the available data) and Abstracts Views on Vision4Press platform.
Data correspond to usage on the plateform after 2015. The current usage metrics is available 48-96 hours after online publication and is updated daily on week days.
Initial download of the metrics may take a while.