Fig. 13
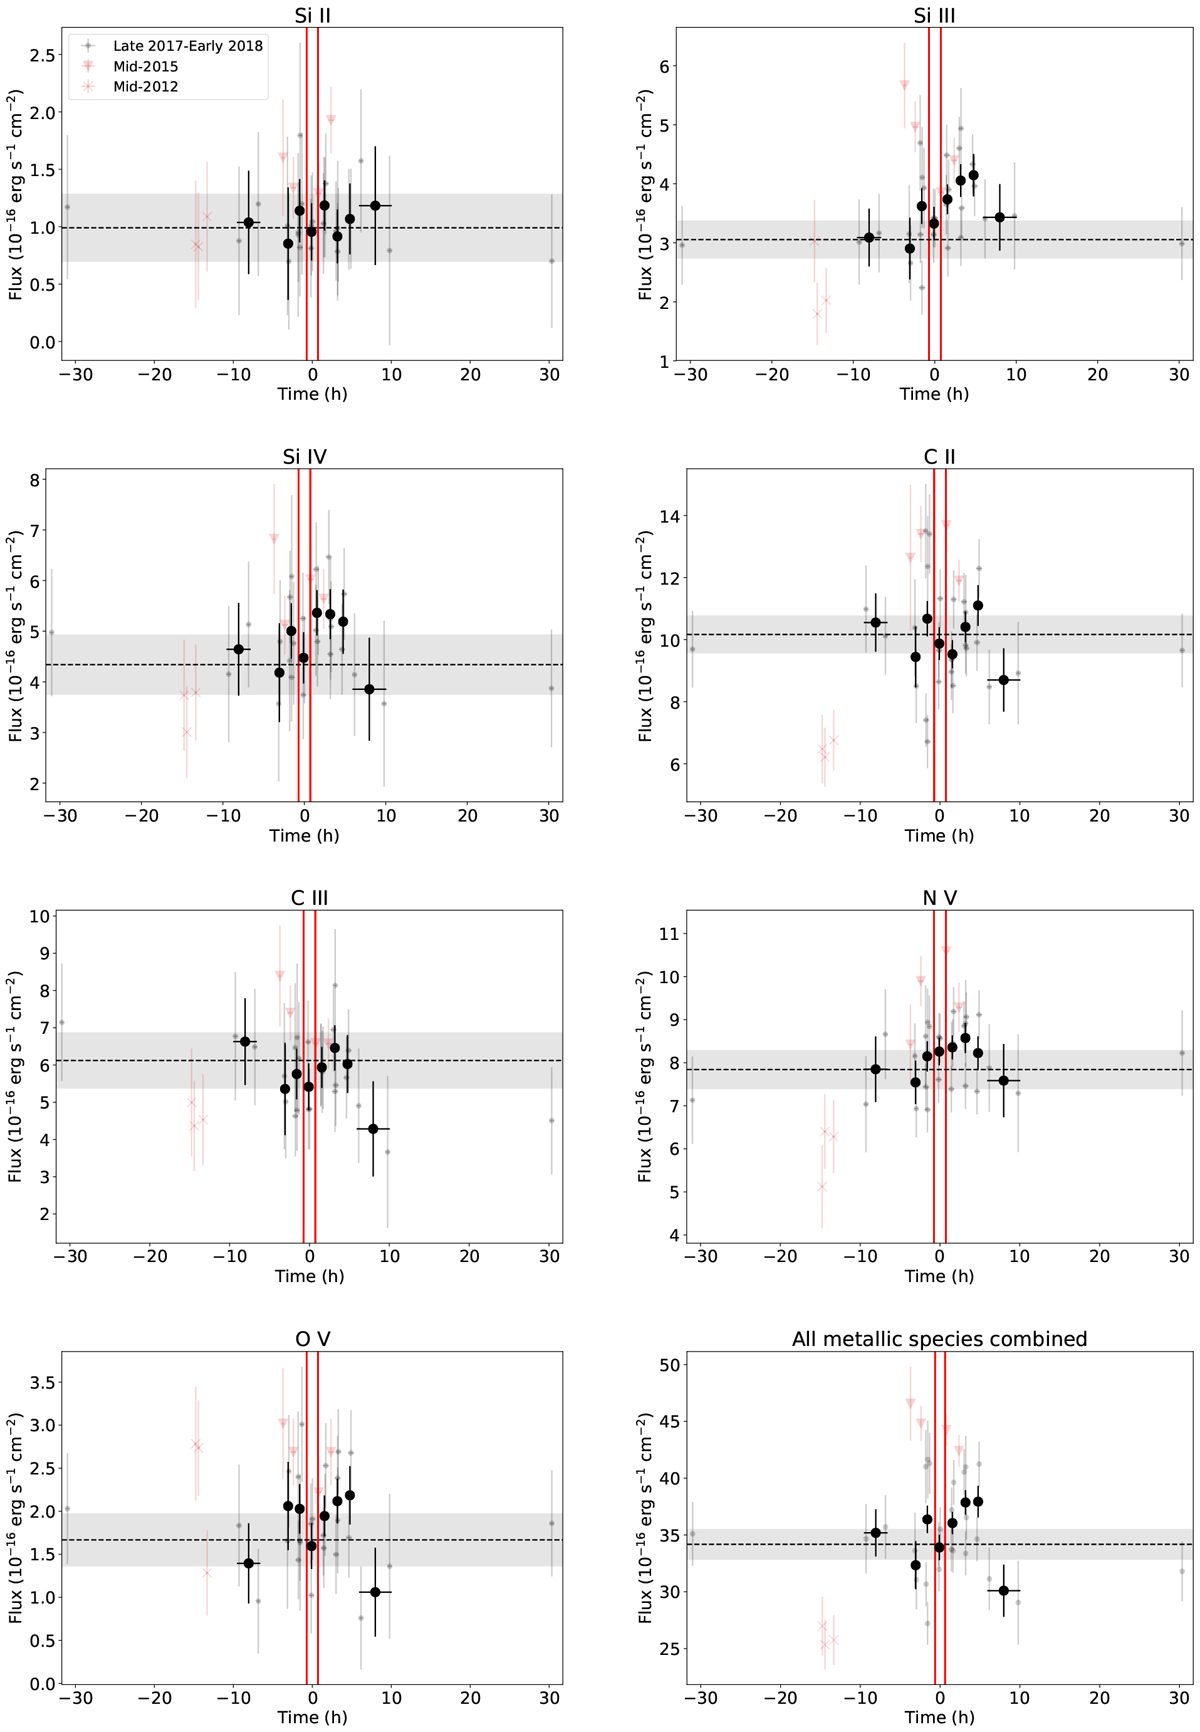
Light curves of FUV stellar lines during transit of GJ 436 b. The larger circular symbols represent the late 2017-early 2018 data binned in phase. The red vertical lines represent the ingress and egress of the optical transit. The vertical dashed line and the gray region represent, respectively, the mean and 1σ uncertainty of the baseline measured asymmetrically, similarly to the Lyman-α baseline.
Current usage metrics show cumulative count of Article Views (full-text article views including HTML views, PDF and ePub downloads, according to the available data) and Abstracts Views on Vision4Press platform.
Data correspond to usage on the plateform after 2015. The current usage metrics is available 48-96 hours after online publication and is updated daily on week days.
Initial download of the metrics may take a while.