Fig. 12
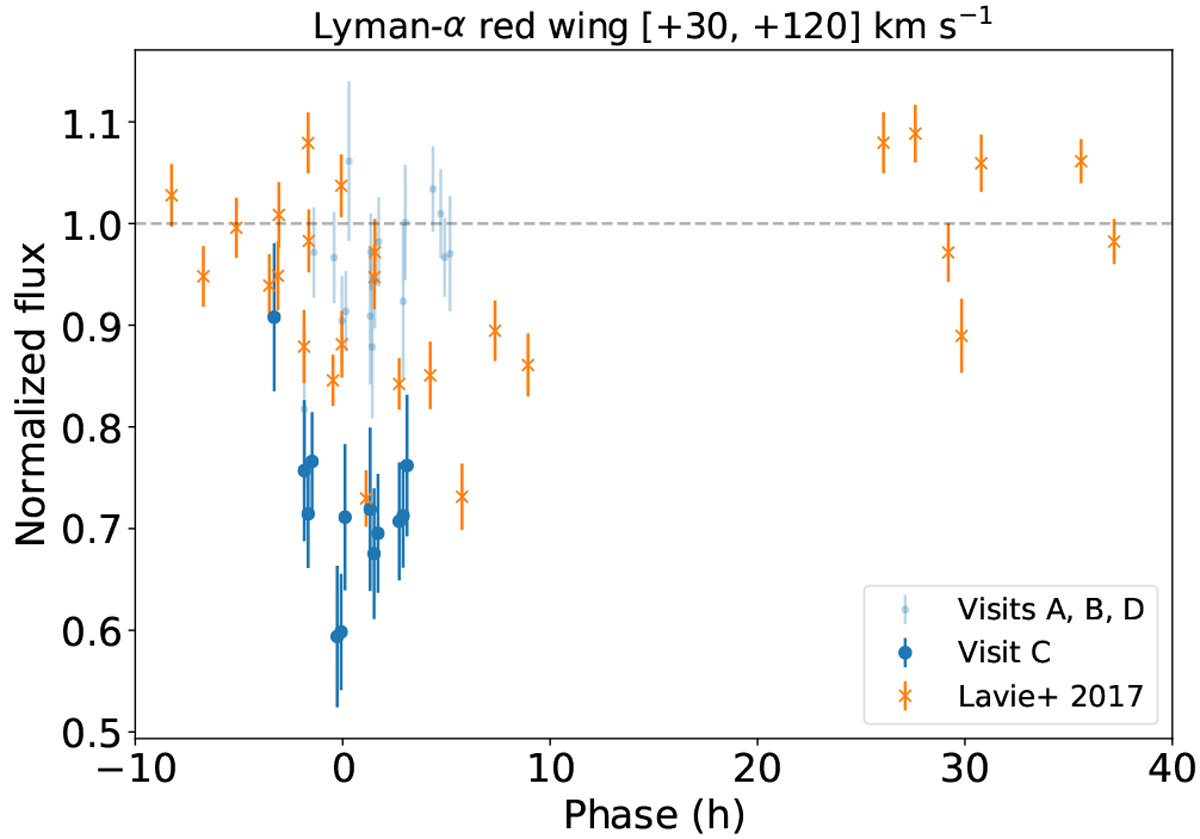
Normalized light curve of red wing (region IV) fluxes during transit of GJ 436 b. The baseline flux used for normalization was computed in the same way as in Fig. 10. Visits A, B, and D display fluxes similar to the baseline value, while Visit C displays a decrease in flux by ~30% in relation to the baseline. The excess absorption in Visit C is likely physical and traces possible inflow of material to the host star.
Current usage metrics show cumulative count of Article Views (full-text article views including HTML views, PDF and ePub downloads, according to the available data) and Abstracts Views on Vision4Press platform.
Data correspond to usage on the plateform after 2015. The current usage metrics is available 48-96 hours after online publication and is updated daily on week days.
Initial download of the metrics may take a while.