Free Access
Fig. 11
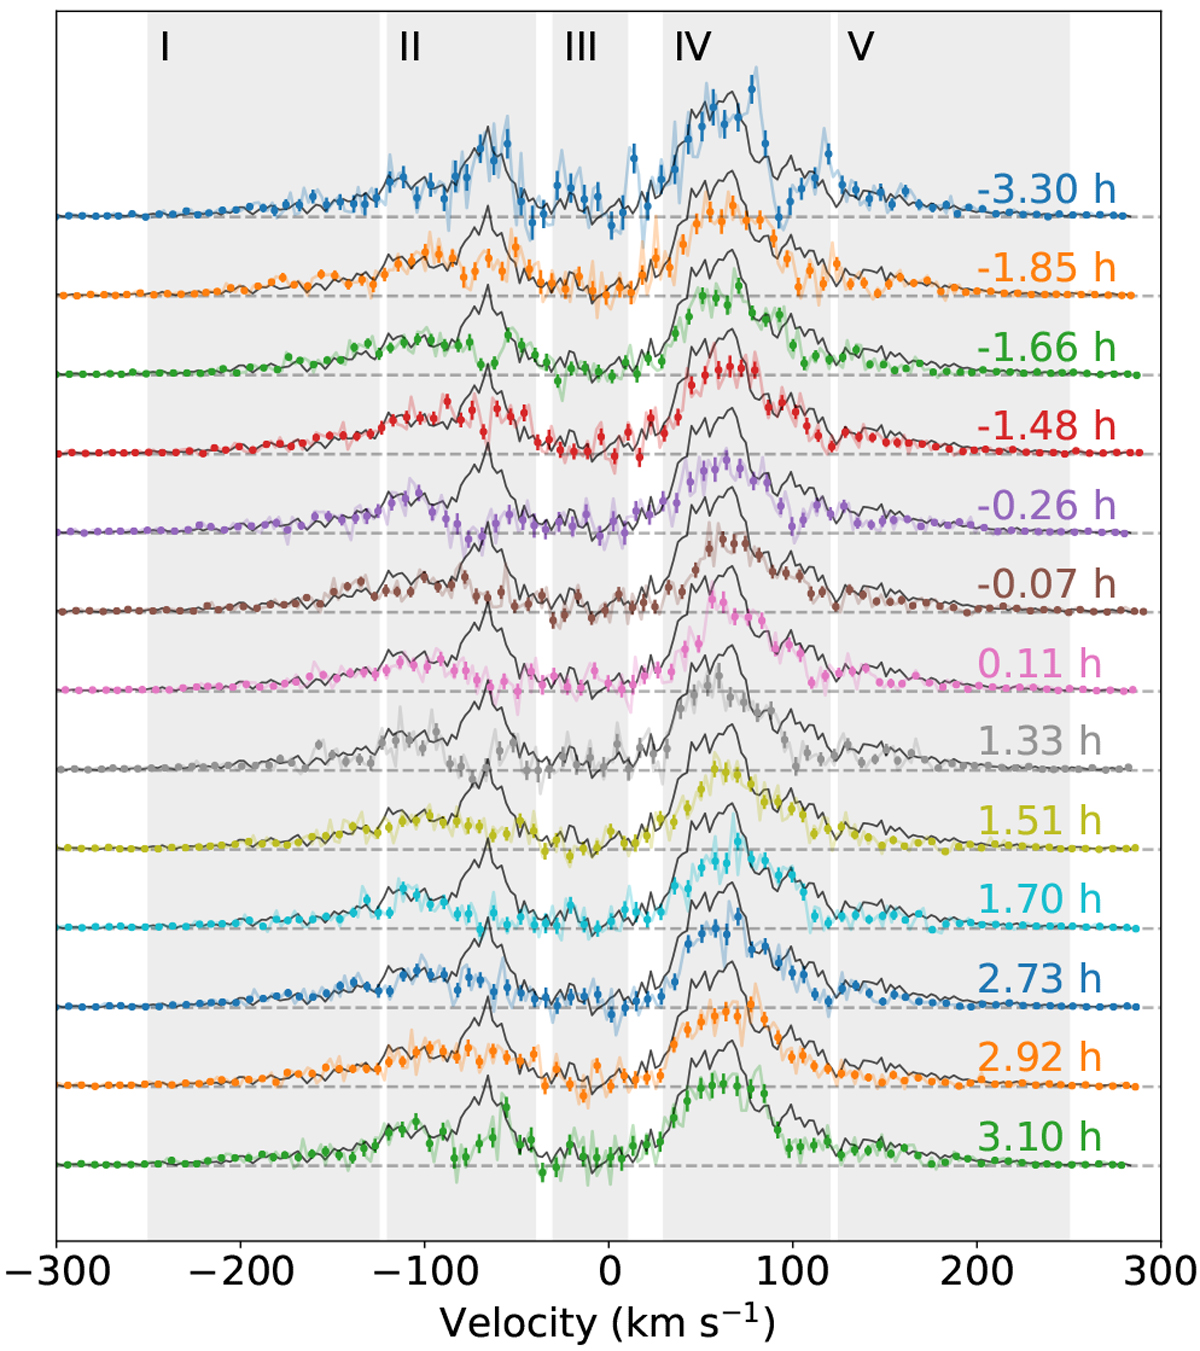
Same as Fig. 9, but for subexposures of Visit C. In addition to the persistent in-transit absorption seen in the blue wing (region II), this visit also displays a 30%-deep excess absorption signal in the Lyman-α red wing (region IV).
Current usage metrics show cumulative count of Article Views (full-text article views including HTML views, PDF and ePub downloads, according to the available data) and Abstracts Views on Vision4Press platform.
Data correspond to usage on the plateform after 2015. The current usage metrics is available 48-96 hours after online publication and is updated daily on week days.
Initial download of the metrics may take a while.