Fig. 8.
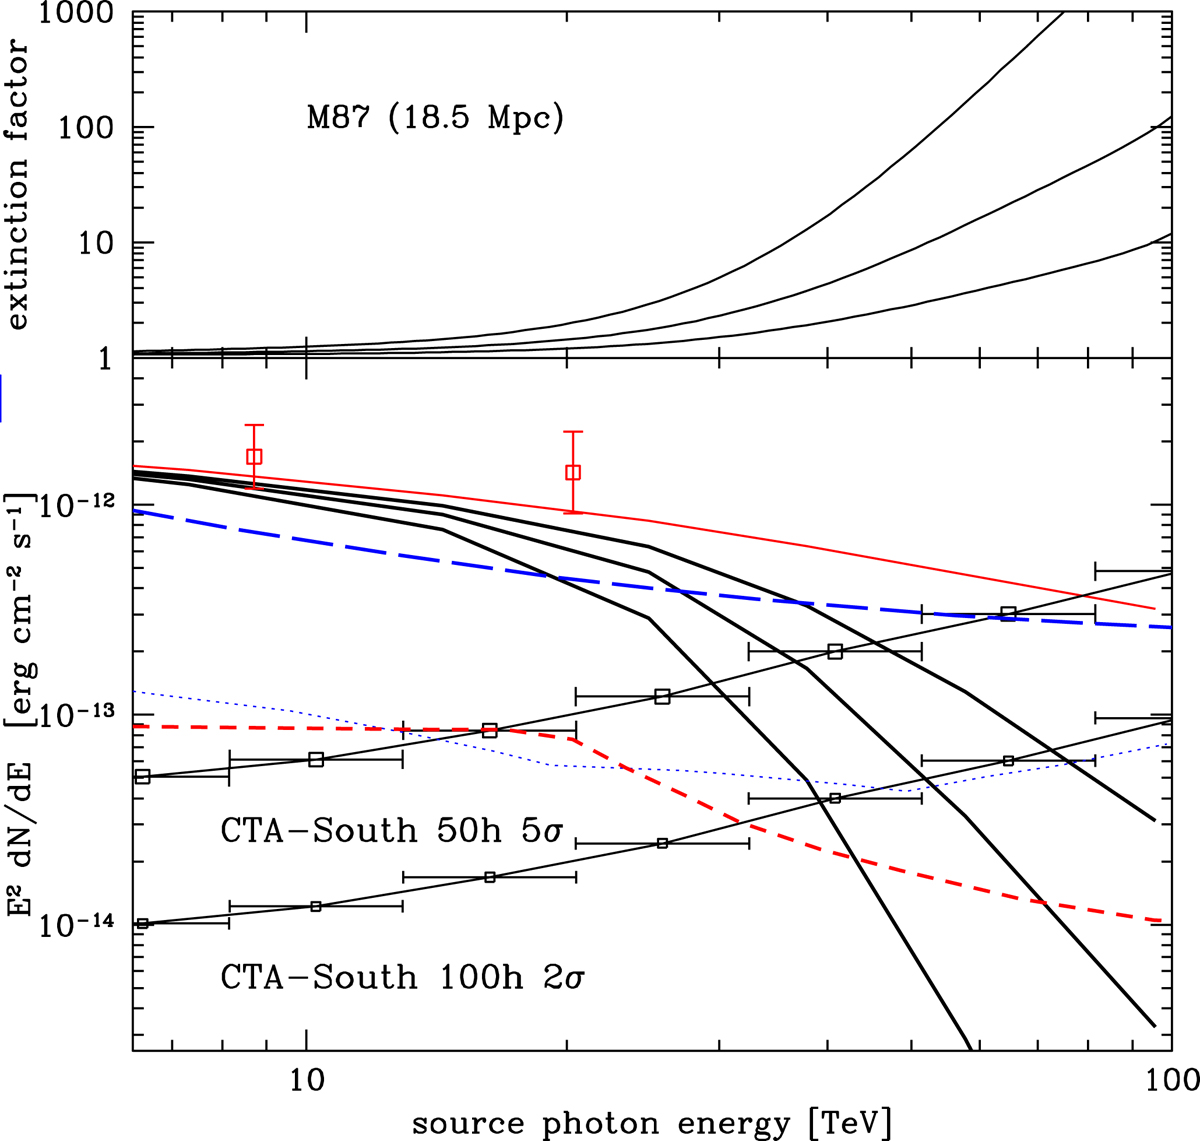
Top panel: photon–photon absorption correction to be applied to the M 87 spectrum for three IR EBL adopted intensities. The intermediate curve corresponds to the FR2017, and the upper and lower curves to IR EBL intensities a factor two higher and lower between 10 and 100 μm. Bottom panel: as in Fig. 6, for the three IR EBL models. The 50-h 5σ and 100-h 2σ sensitivity limits for CTA, and the HAWC and LHAASO five-year 5σ limits are also indicated.
Current usage metrics show cumulative count of Article Views (full-text article views including HTML views, PDF and ePub downloads, according to the available data) and Abstracts Views on Vision4Press platform.
Data correspond to usage on the plateform after 2015. The current usage metrics is available 48-96 hours after online publication and is updated daily on week days.
Initial download of the metrics may take a while.