Fig. 5.
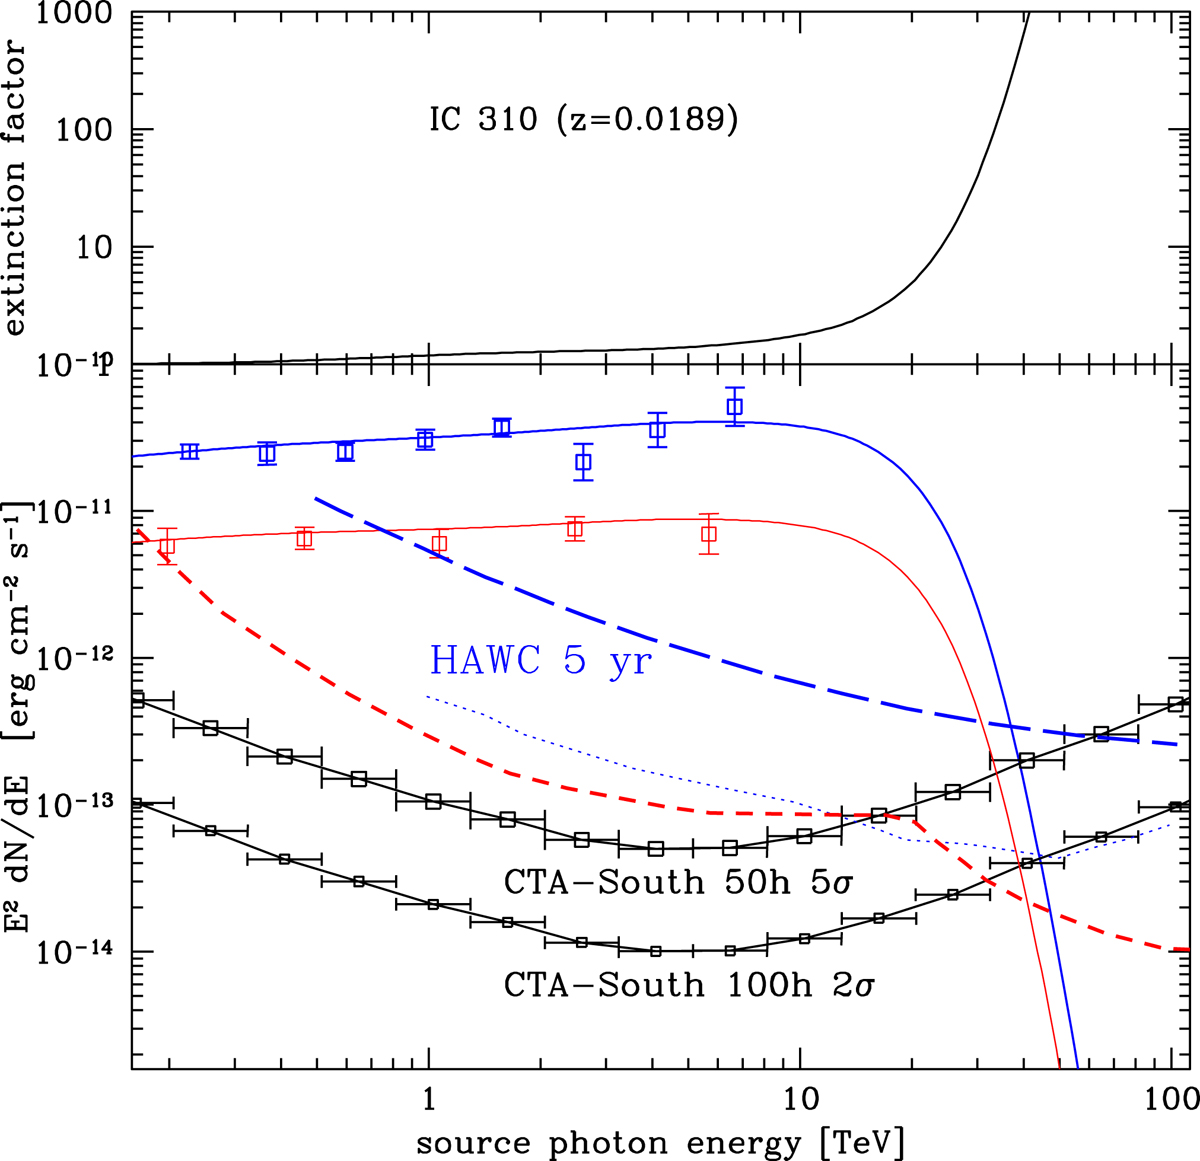
Top panel: photon–photon absorption correction (exp[τγγ]) for the source IC 310 at z = 0.0189, based on the EBL model by FR2017. Bottom panel: blue data-points and continuous line were taken during an outburst phase, the red data and continuous line during a prolonged high-state (see text). The 50-h 5σ and 100 h 2σ sensitivity limits for CTA, and the HAWC 5 years limits are shown. The blue dotted line and the red dashed one indicate the SWGO and LHAASO 5 years 5σ limits, respectively.
Current usage metrics show cumulative count of Article Views (full-text article views including HTML views, PDF and ePub downloads, according to the available data) and Abstracts Views on Vision4Press platform.
Data correspond to usage on the plateform after 2015. The current usage metrics is available 48-96 hours after online publication and is updated daily on week days.
Initial download of the metrics may take a while.