Fig. 4.
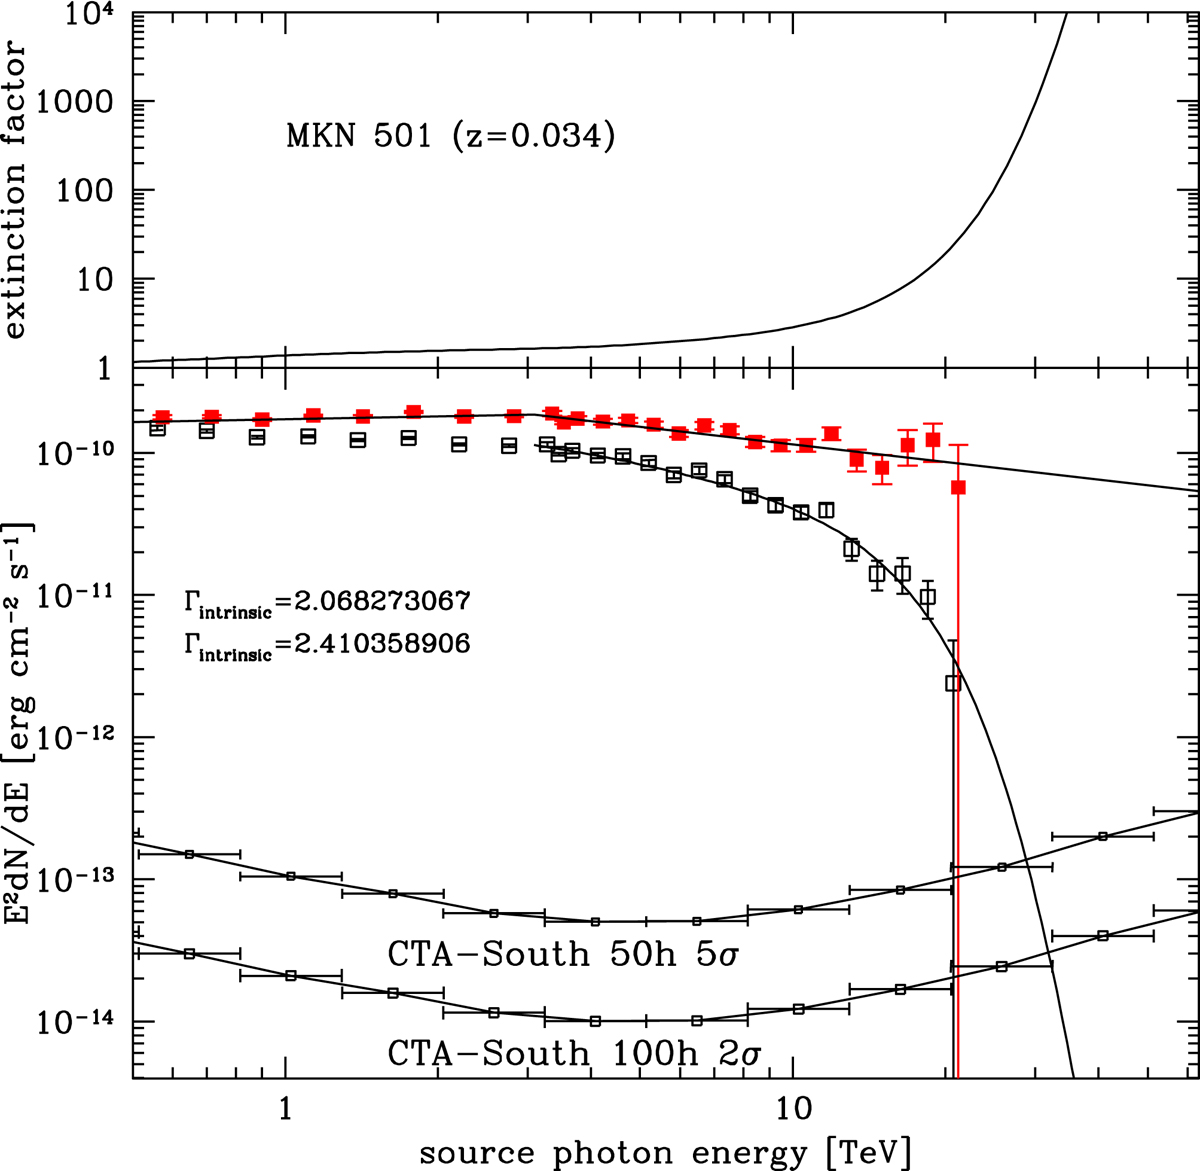
Top panel: photon–photon absorption correction (exp[τγγ]) for the source MKN 501 at z = 0.034 based on the EBL model by FR2017. Bottom panel: observed (open black) and absorption-corrected (filled red) spectral data. Data are taken from Aharonian et al. (2001); see also Aharonian et al. (2006c). The intrinsic spectrum is fitted by a broken power-law with relatively flat photon spectral indices, as indicated in the insert. The energy-binned sensitivity limits for 50-h 5σ and 100-h 2σ of CTA South are also shown.
Current usage metrics show cumulative count of Article Views (full-text article views including HTML views, PDF and ePub downloads, according to the available data) and Abstracts Views on Vision4Press platform.
Data correspond to usage on the plateform after 2015. The current usage metrics is available 48-96 hours after online publication and is updated daily on week days.
Initial download of the metrics may take a while.