Fig. 1.
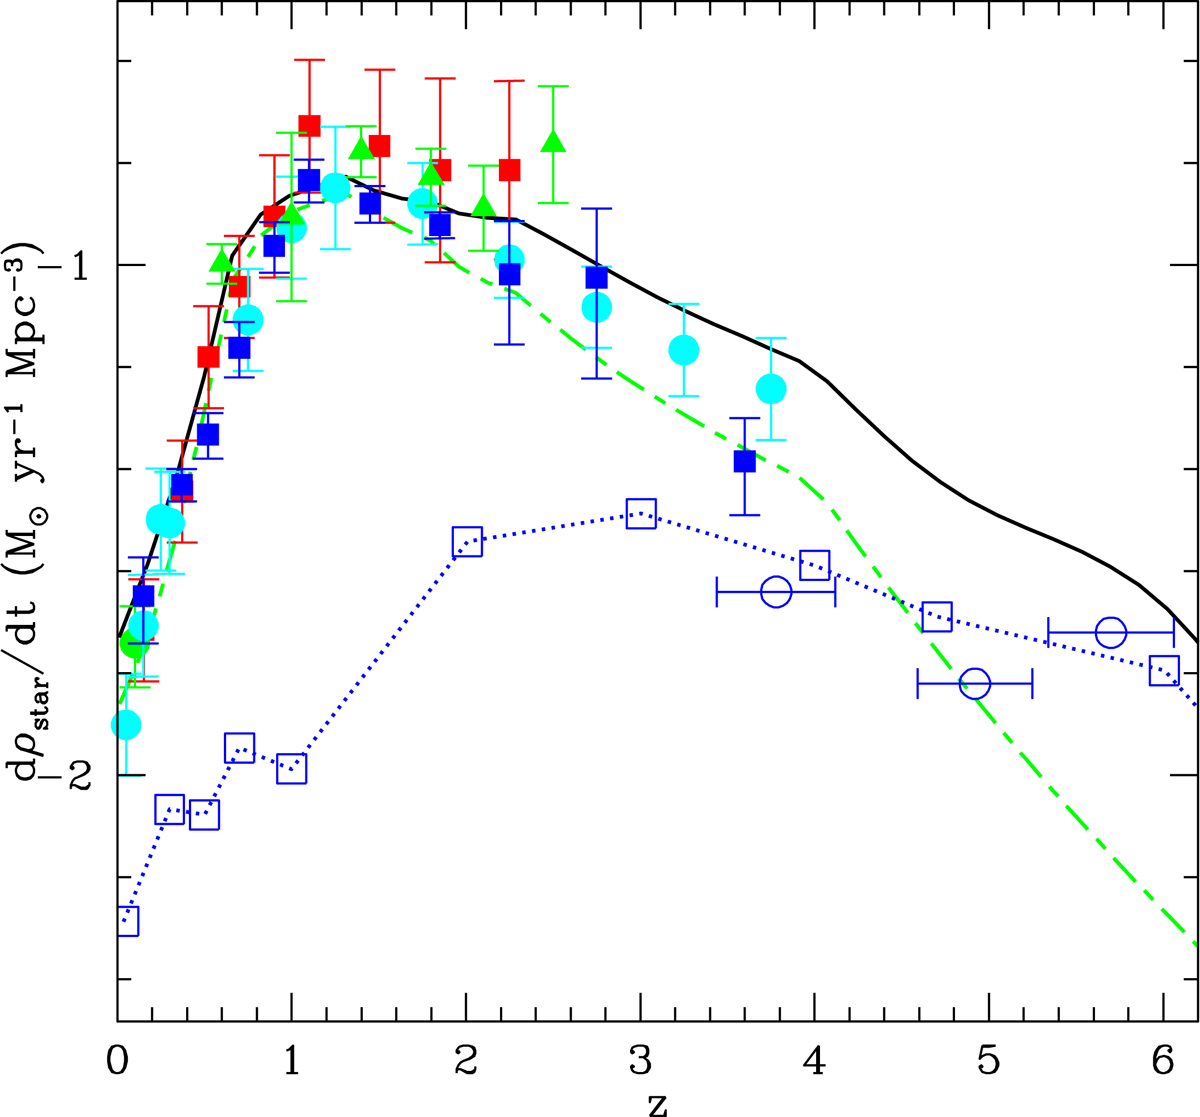
Global SFR per comoving volume traced by IR and UV observations as a function of redshift. The plot adopts a standard Salpeter stellar IMF. Here the blue filled squares are an estimate of the SFR density by Gruppioni et al. (2013) after subtraction of the type-I AGN contribution, which should be matched to the green long-short dash curve that is the total contribution to SFR by IR-selected LIRGs and ULIRGs (type-I AGNs excluded). The blue dotted line with open squares traces our estimated comoving SFR density derived from UV observations, with no extinction corrections. The black continuous curve shows the total SF activity by FIR and far-UV selections. Open circle datapoints are from Giavalisco et al. (2004), also uncorrected for dust-extinction.
Current usage metrics show cumulative count of Article Views (full-text article views including HTML views, PDF and ePub downloads, according to the available data) and Abstracts Views on Vision4Press platform.
Data correspond to usage on the plateform after 2015. The current usage metrics is available 48-96 hours after online publication and is updated daily on week days.
Initial download of the metrics may take a while.