Fig. 2.
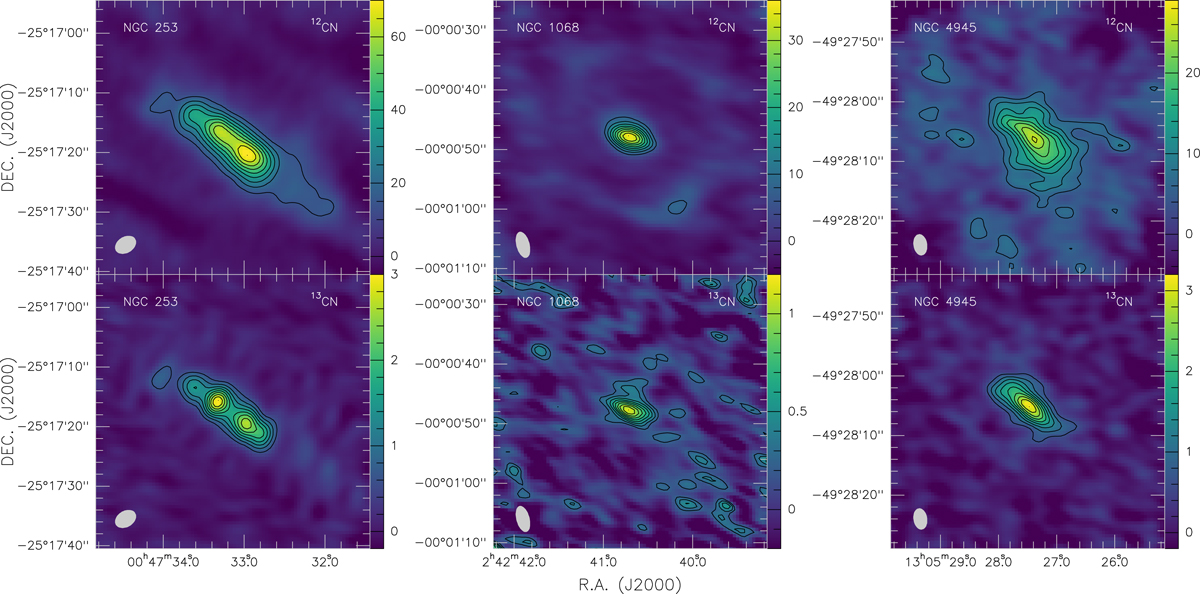
Integrated intensity maps (color bars in units of Jy beam−1 km s−1) of 12CN (I(12CN J = 1/2–1/2)+I(12CN J = 3/2–1/2)) and 13CN (I(13CN J = 1/2–1/2)+I(13CN J = 3/2–1/2)) of NGC 253 (12CN and 13CN integrated frequency range: 112.960–113.491 and 108.526–108.744 GHz; left), NGC 1068 (12CN and 13CN integrated frequency range: 112.641–113.169 and 108.170–108.459 GHz; middle), and NGC 4945 (12CN and 13CN integrated frequency range: 112.809–113.377 and 108.363–108.653 GHz; right). The contour levels are from 20% to 100% with steps of 10% for 12CN and 13CN of the peak intensity. The 12CN peak intensities are 71.9, 35.8, and 26.4 Jy beam−1 km s−1, and the 13CN peak intensities are 3.0, 1.1, and 3.2 Jy beam−1 km s−1 in NGC 253, NGC 1068, and NGC 4945, respectively. For the 12CN map of NGC 253, see also Meier et al. (2015). The pixel size of each image is 0.3″ × 0.3″. The synthesized beam of each image is shown in the lower left corner.
Current usage metrics show cumulative count of Article Views (full-text article views including HTML views, PDF and ePub downloads, according to the available data) and Abstracts Views on Vision4Press platform.
Data correspond to usage on the plateform after 2015. The current usage metrics is available 48-96 hours after online publication and is updated daily on week days.
Initial download of the metrics may take a while.