Fig. 9.
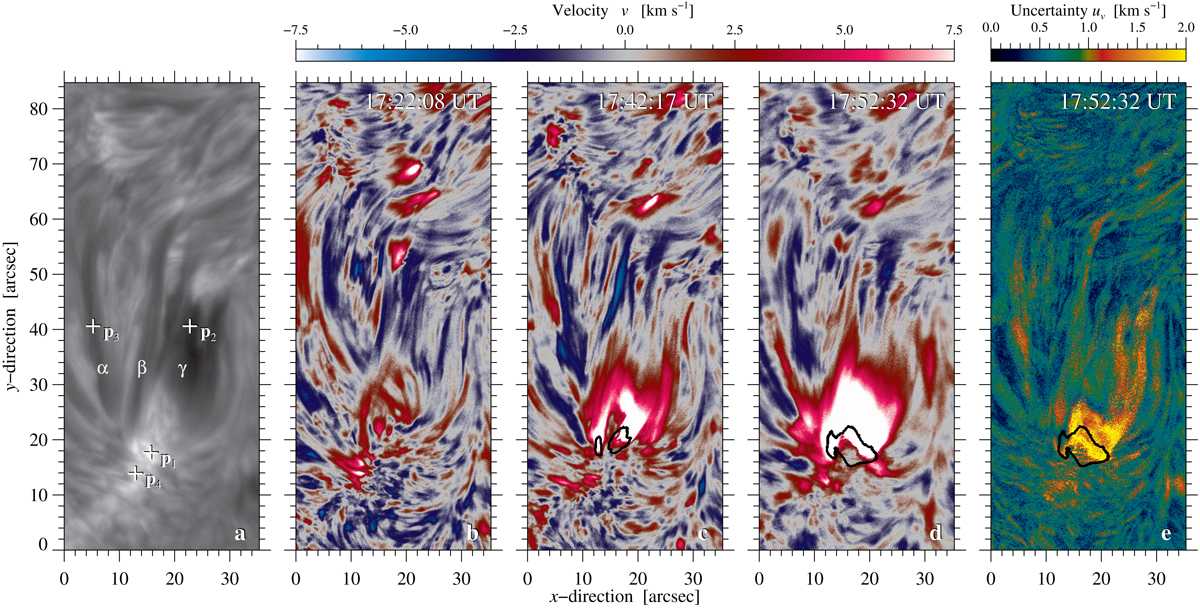
Panel a: Hα line-core image and Doppler velocity maps (panel b) at 17:22:08 UT, panel c: at 17:42:17 UT, and panel d: at 17:52:32 UT. All velocity maps are clipped between ±7.5 km s−1, i.e., the saturated white regions denote velocities exceeding this limit. The points p1–p4 refer to regions, which we examine in detail. The black contours show the regions with two spectral components indicating very strong redshifts. The labels α, β, and γ indicate three individual arch filaments, which are discussed in the text. Panel e: map of the uncertainties uv of the LOS velocities from the line-core fits exemplary for the LOS map at 17:52:32 UT
Current usage metrics show cumulative count of Article Views (full-text article views including HTML views, PDF and ePub downloads, according to the available data) and Abstracts Views on Vision4Press platform.
Data correspond to usage on the plateform after 2015. The current usage metrics is available 48-96 hours after online publication and is updated daily on week days.
Initial download of the metrics may take a while.