Free Access
Fig. 8.
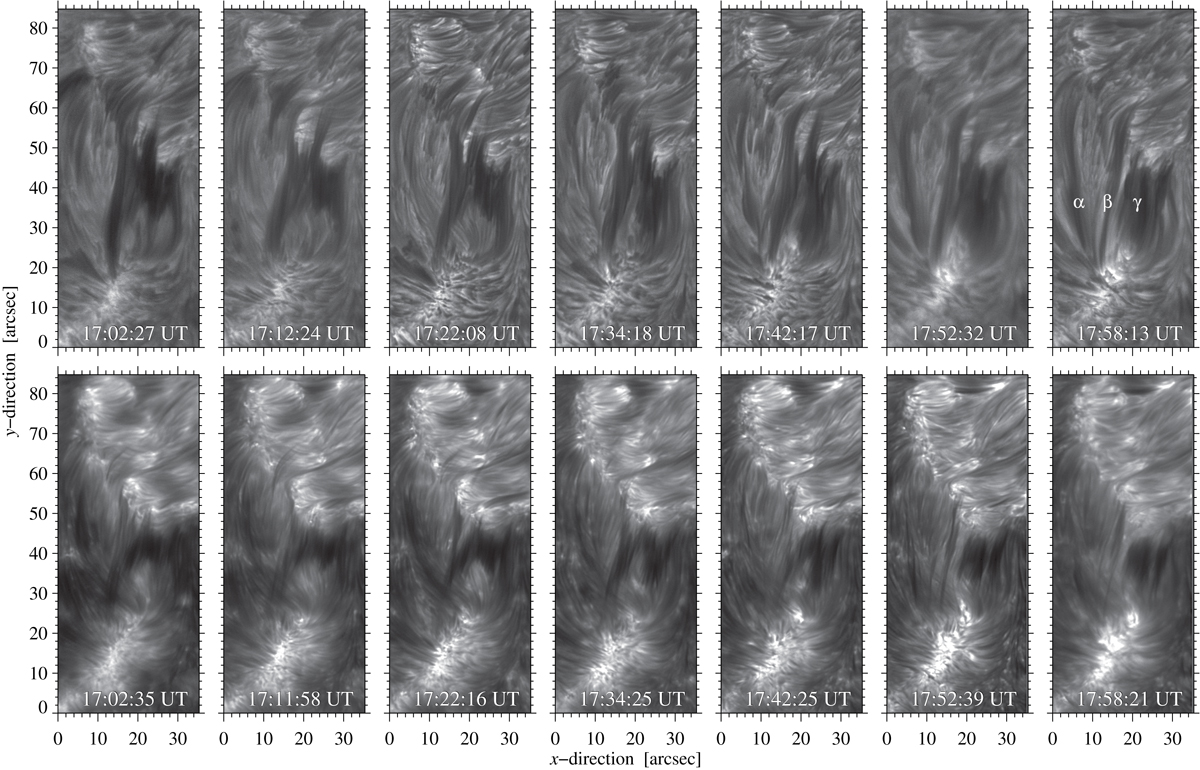
Temporal evolution of the extended AFS in the chromosphere in selected Hα line-core filtergrams (top) and in NIR Ca II line-core filtergrams (bottom) for a time-series starting at 17:02 UT until 17:58 UT on 2013 January 20. The labels α, β, and γ indicate three individual arch filaments, which are discussed in the text.
Current usage metrics show cumulative count of Article Views (full-text article views including HTML views, PDF and ePub downloads, according to the available data) and Abstracts Views on Vision4Press platform.
Data correspond to usage on the plateform after 2015. The current usage metrics is available 48-96 hours after online publication and is updated daily on week days.
Initial download of the metrics may take a while.