Fig. 7.
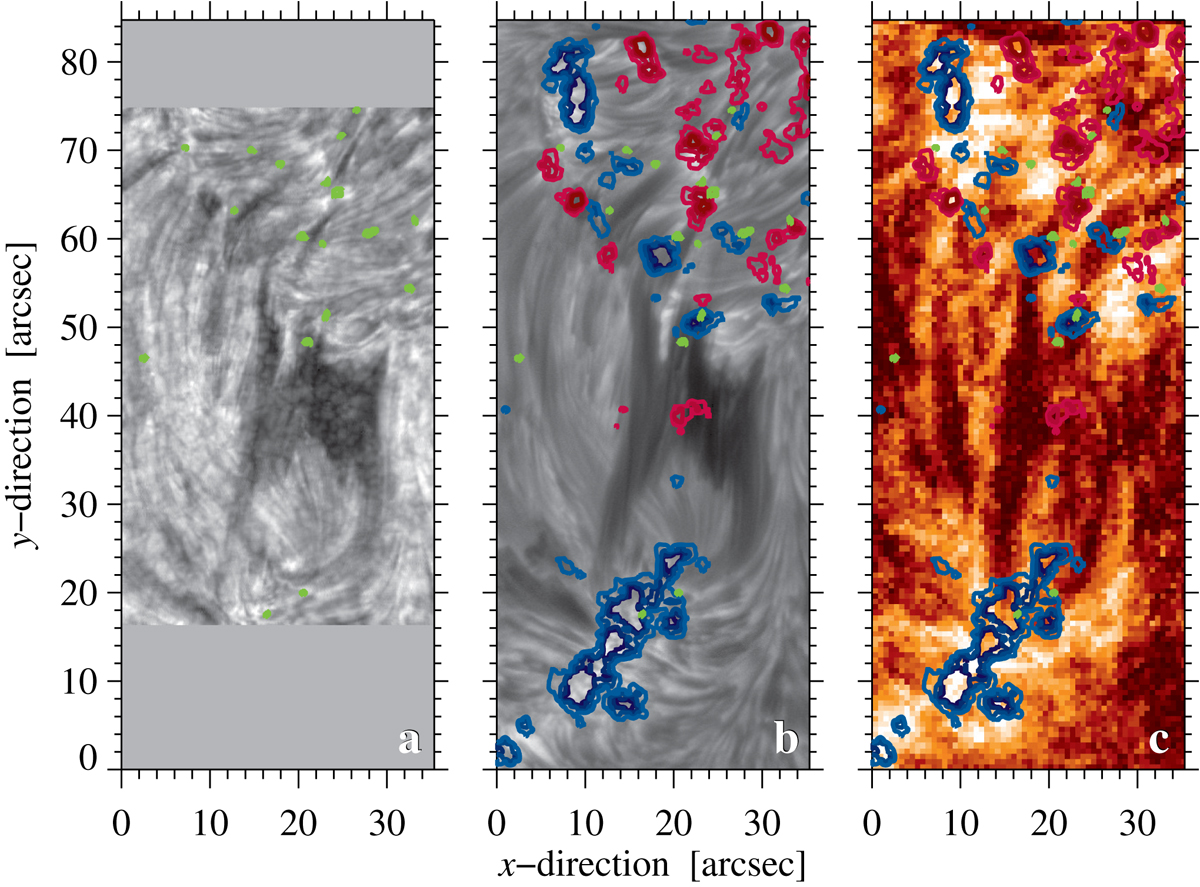
Comparison of the extended AFS observed with different instruments. Panel a: ROSA Hβ image with contours of G-band bright points (green). Panel b: IBIS Hα line-core filtergram with contours of the positive (red) and negative (blue) LOS magnetic field from HMI between ±50 G and ±200 G in steps of 50 G, where darker colors indicate stronger magnetic fields. Panel c: NAFE-enhanced AIA image.
Current usage metrics show cumulative count of Article Views (full-text article views including HTML views, PDF and ePub downloads, according to the available data) and Abstracts Views on Vision4Press platform.
Data correspond to usage on the plateform after 2015. The current usage metrics is available 48-96 hours after online publication and is updated daily on week days.
Initial download of the metrics may take a while.