Free Access
Fig. 3.
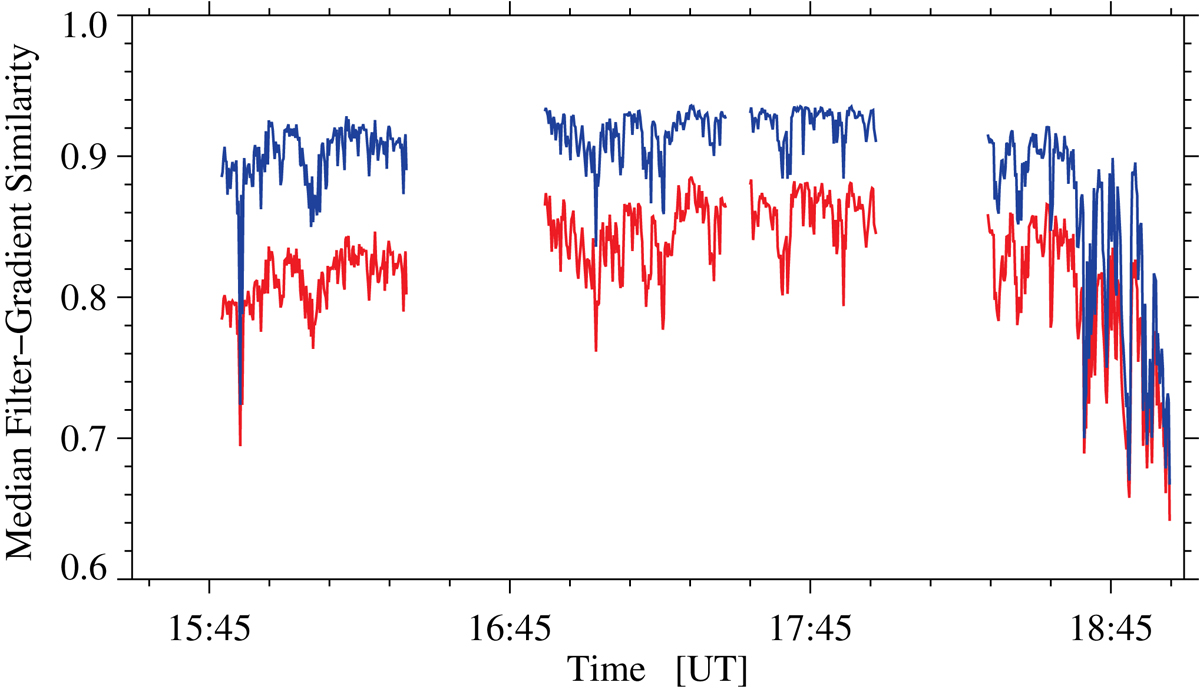
Image quality of G-band images derived with the MFGS method for the entire observing period. The red curve refers to calibrated G-band images, whereas the blue profile corresponds to MFGS values after image restoration. At around 18:21 UT the target changed from the arch filament system to the nearby sunspot.
Current usage metrics show cumulative count of Article Views (full-text article views including HTML views, PDF and ePub downloads, according to the available data) and Abstracts Views on Vision4Press platform.
Data correspond to usage on the plateform after 2015. The current usage metrics is available 48-96 hours after online publication and is updated daily on week days.
Initial download of the metrics may take a while.