Fig. 2.
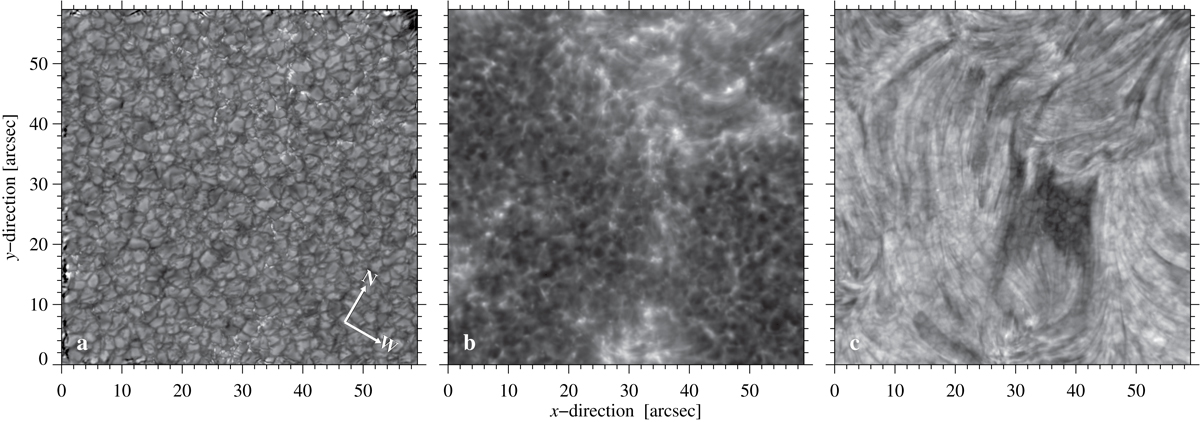
Best ROSA images on 2013 January 20: Panel a: G-band image showing the photosphere at 17:21:39 UT, where some restoration artifacts are visible at the borders. Panel b: Ca II K image depicting the upper photosphere and lower chromosphere at 17:21:34 UT. Panel c: Hβ image displaying the chromosphere at 17:21:22 UT. The arrows indicate the direction of solar north and west.
Current usage metrics show cumulative count of Article Views (full-text article views including HTML views, PDF and ePub downloads, according to the available data) and Abstracts Views on Vision4Press platform.
Data correspond to usage on the plateform after 2015. The current usage metrics is available 48-96 hours after online publication and is updated daily on week days.
Initial download of the metrics may take a while.