Fig. 12.
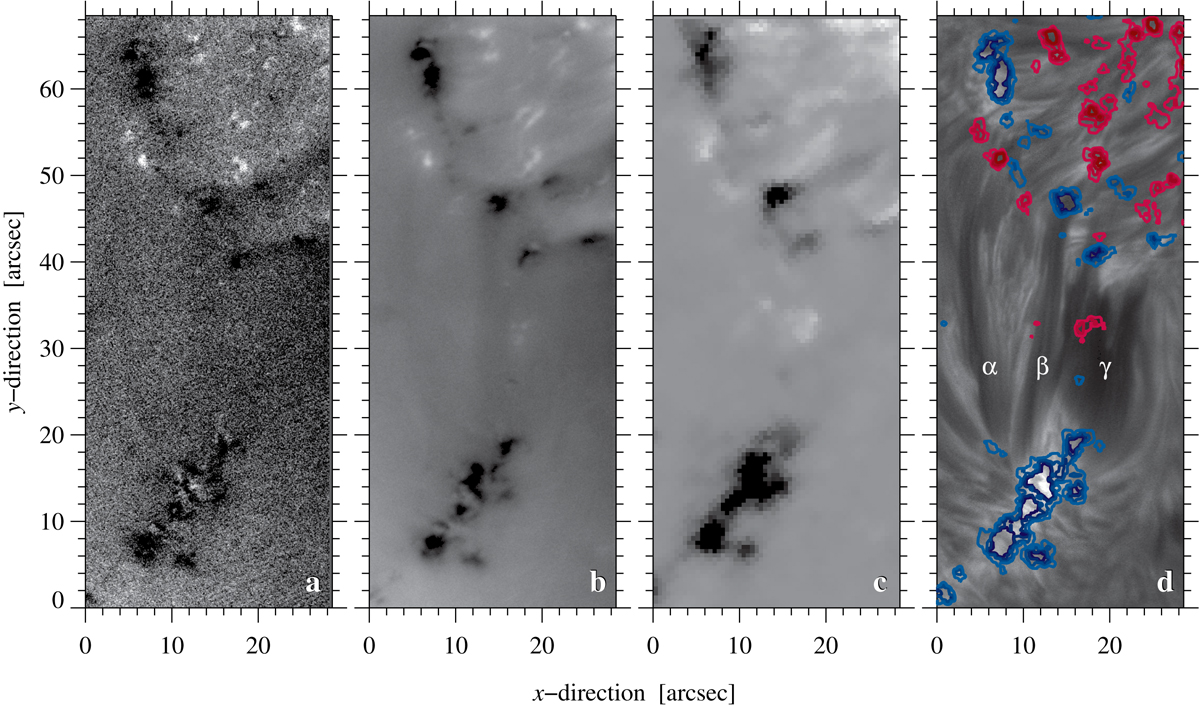
Magnetic field of the extended AFS. Panel a: single-integration IBIS Stokes–V/Ic map derived from the NIR Ca II line at 17:52:39 UT and panel b: one-hour average of IBIS Stokes–V/Ic maps scaled between V/Ic = ±0.005. Panel c: two-hour average HMI magnetogram clipped between ±150 G, showing the positive (white) and negative (black) magnetic polarities. Panel d: Hα image at 17:52:39 UT with contours of the positive (red) and negative (blue) magnetic field between ±50 G and ±200 G in steps of 50 G, where darker colors indicate stronger magnetic fields. The contours were derived from a single HMI magnetogram at 17:36:00 UT. The labels α, β, and γ indicate three individual arch filaments, which are discussed in the text. A movie associated to this figure is available online.
Current usage metrics show cumulative count of Article Views (full-text article views including HTML views, PDF and ePub downloads, according to the available data) and Abstracts Views on Vision4Press platform.
Data correspond to usage on the plateform after 2015. The current usage metrics is available 48-96 hours after online publication and is updated daily on week days.
Initial download of the metrics may take a while.