Free Access
Fig. 10.
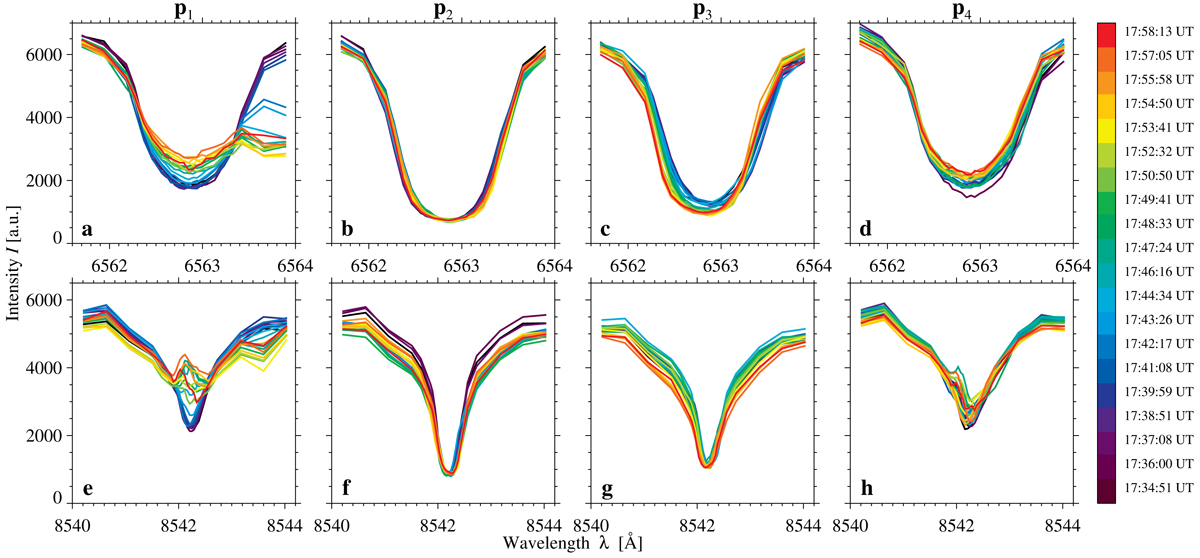
Temporal evolution of the Hα (top) and NIR Ca II (bottom) observed spectra at points p1–p4 (left to right). The color of the spectral profiles corresponds to the observing time given by the scale on the right.
Current usage metrics show cumulative count of Article Views (full-text article views including HTML views, PDF and ePub downloads, according to the available data) and Abstracts Views on Vision4Press platform.
Data correspond to usage on the plateform after 2015. The current usage metrics is available 48-96 hours after online publication and is updated daily on week days.
Initial download of the metrics may take a while.