Fig. 2.
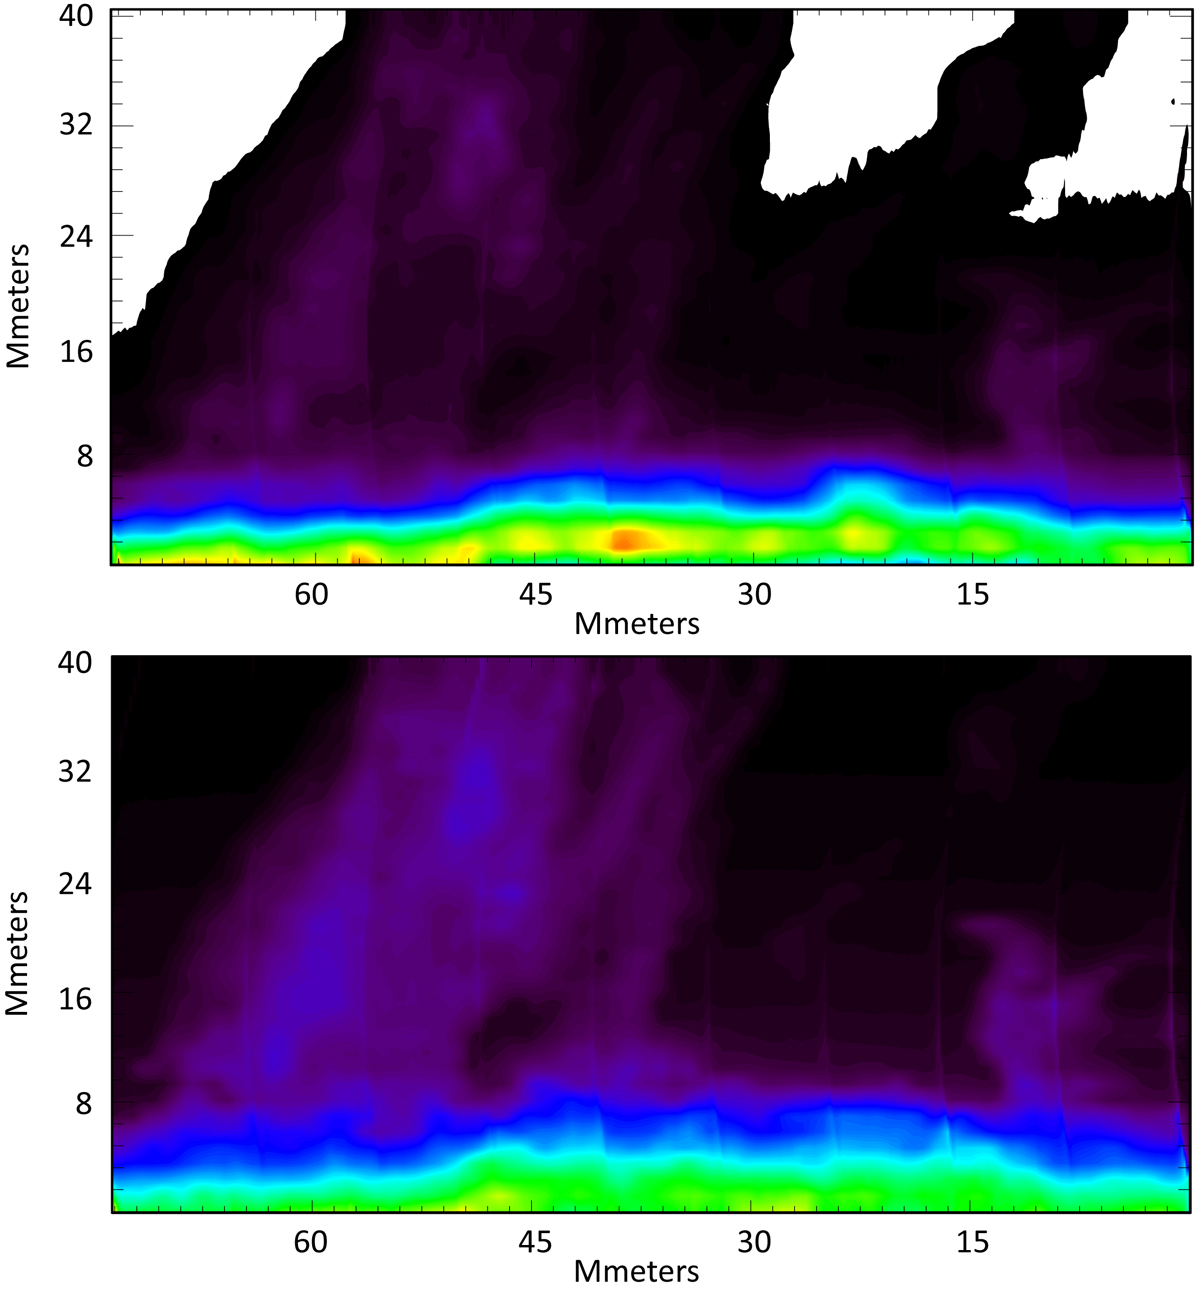
Prominence observed on 13 September 2008 at 11:48−13:40 UT at position angle 229°. Upper image: intensity at the centre of the He I D3 5875.6 Å line. Lower image: intensity at the centre of the hydrogen Hα line. The bottom of the image is parallel to the solar limb. The warm colours (yellow, red) indicate the highest intensities, which are located at the solar limb.
Current usage metrics show cumulative count of Article Views (full-text article views including HTML views, PDF and ePub downloads, according to the available data) and Abstracts Views on Vision4Press platform.
Data correspond to usage on the plateform after 2015. The current usage metrics is available 48-96 hours after online publication and is updated daily on week days.
Initial download of the metrics may take a while.