Fig. 2.
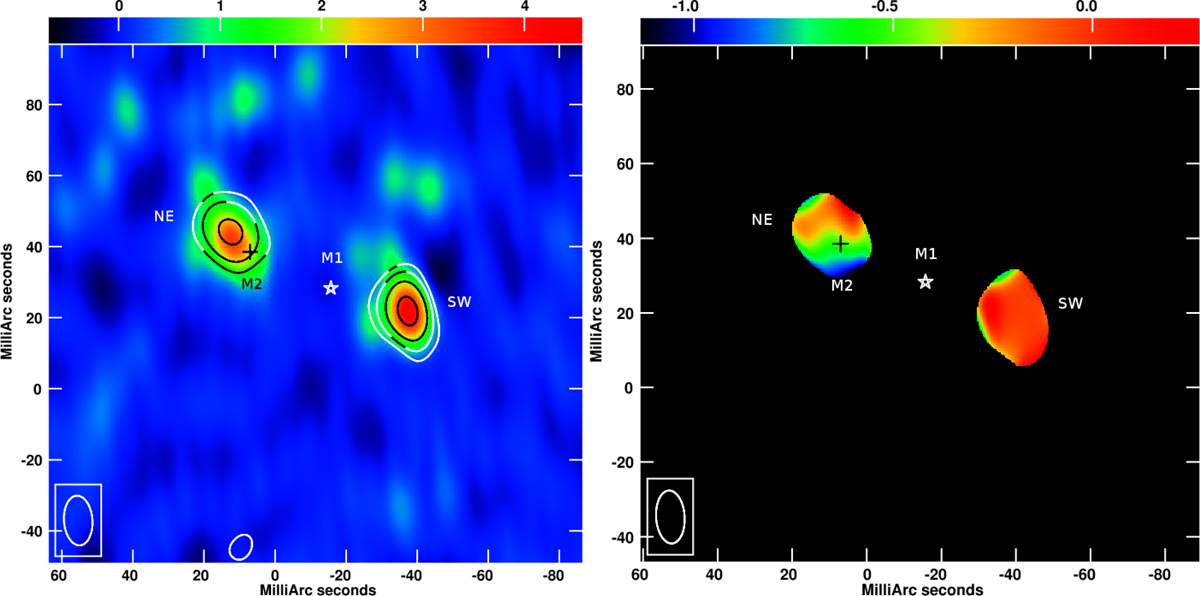
Radio continuum emission in the nucleus of IRAS 15480 (left). The color scale represents emission at L-band (shifted as described in Appendix A), ranging from −0.7 to 4.6 mJy beam−1, while the overlaid contours delineate the C-band emission convolved with the L-band beam (contour levels are −1, 1, 2, 4, 8, 16, 32, 64 × 0.45 mJy beam−1). Spectral index map of the nuclear region in IRAS 15480 (right). The map shows only the emission regions above the 5σ noise level. The positions of the water maser spots detected with the VLBA are also indicated. The star and the cross mark the location of the narrow (M1) and the broad blueshifted line emission (M2), respectively (for details see Castangia et al. 2016).
Current usage metrics show cumulative count of Article Views (full-text article views including HTML views, PDF and ePub downloads, according to the available data) and Abstracts Views on Vision4Press platform.
Data correspond to usage on the plateform after 2015. The current usage metrics is available 48-96 hours after online publication and is updated daily on week days.
Initial download of the metrics may take a while.