Fig. 4
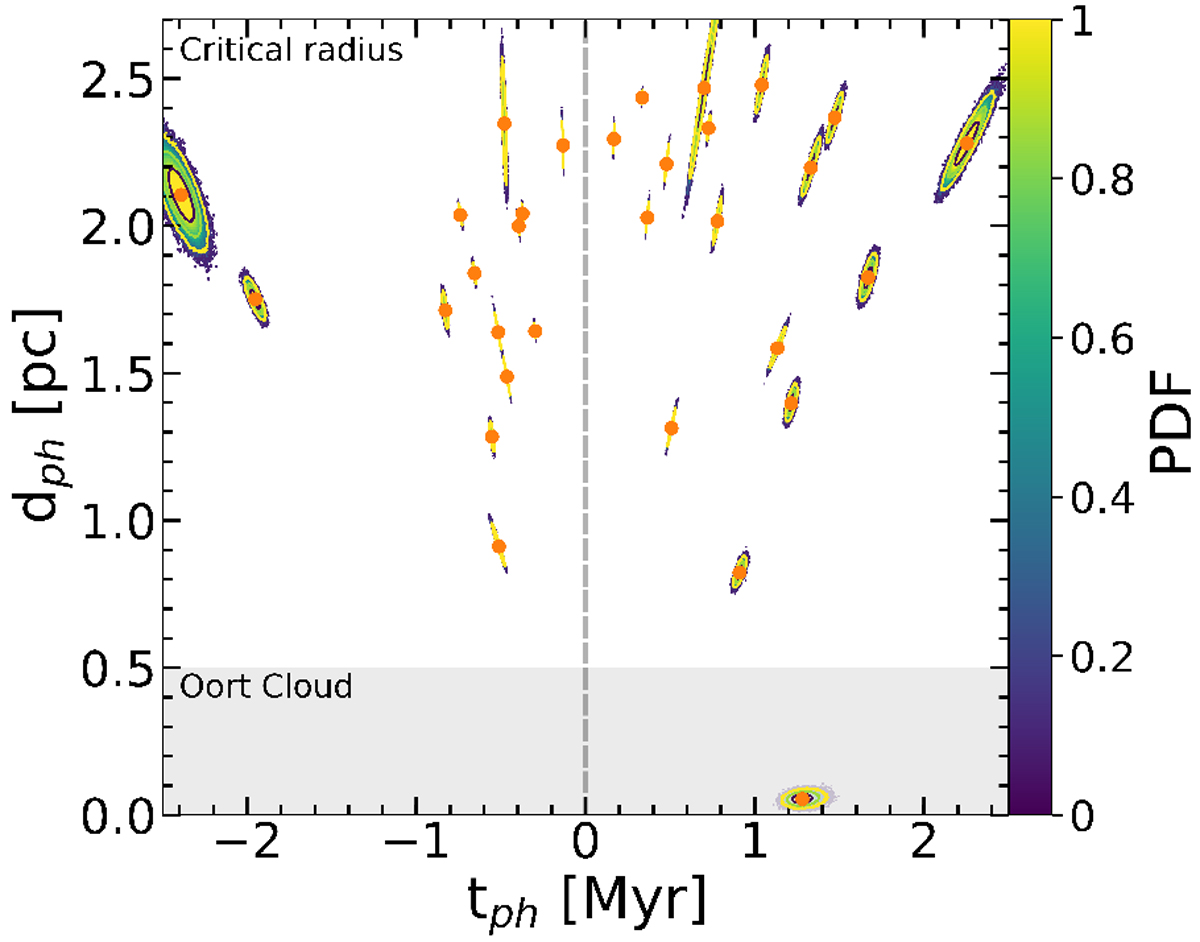
Joint probability density of the time and distance of closest approach for those stars that are predicted to pass within 2.5 pc of the Sun (listed in Table 3). The contour levels indicate regions enclosing 0.6, 0.9, and 0.99% cumulative probability (colour bar). The shape of each PDF is affected by the relative errors in the observational data of each star, particularly the errors on parallax and radial velocity.
Current usage metrics show cumulative count of Article Views (full-text article views including HTML views, PDF and ePub downloads, according to the available data) and Abstracts Views on Vision4Press platform.
Data correspond to usage on the plateform after 2015. The current usage metrics is available 48-96 hours after online publication and is updated daily on week days.
Initial download of the metrics may take a while.