Free Access
Fig. 3
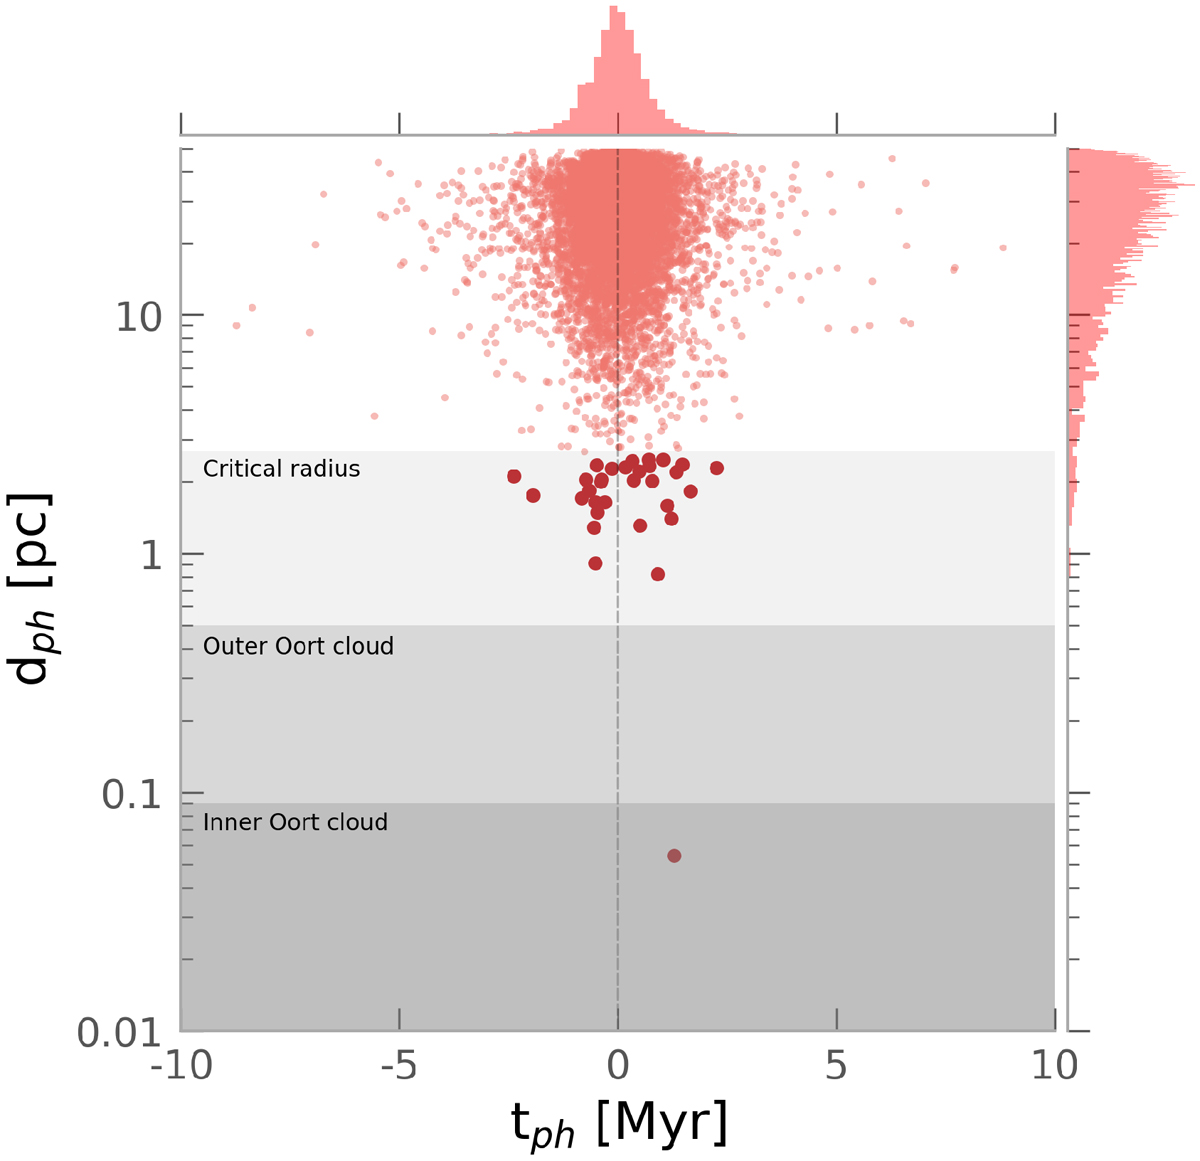
Closest approach distance vs. closest approach time. The shaded areas represent the critical radius within which stars can affect an object in the Oort cloud, and the boundaries of the outer and inner Oort cloud, respectively. The big dots correspond to those stars that pass within 2.5 pc of the Sun.
Current usage metrics show cumulative count of Article Views (full-text article views including HTML views, PDF and ePub downloads, according to the available data) and Abstracts Views on Vision4Press platform.
Data correspond to usage on the plateform after 2015. The current usage metrics is available 48-96 hours after online publication and is updated daily on week days.
Initial download of the metrics may take a while.