Fig. 11
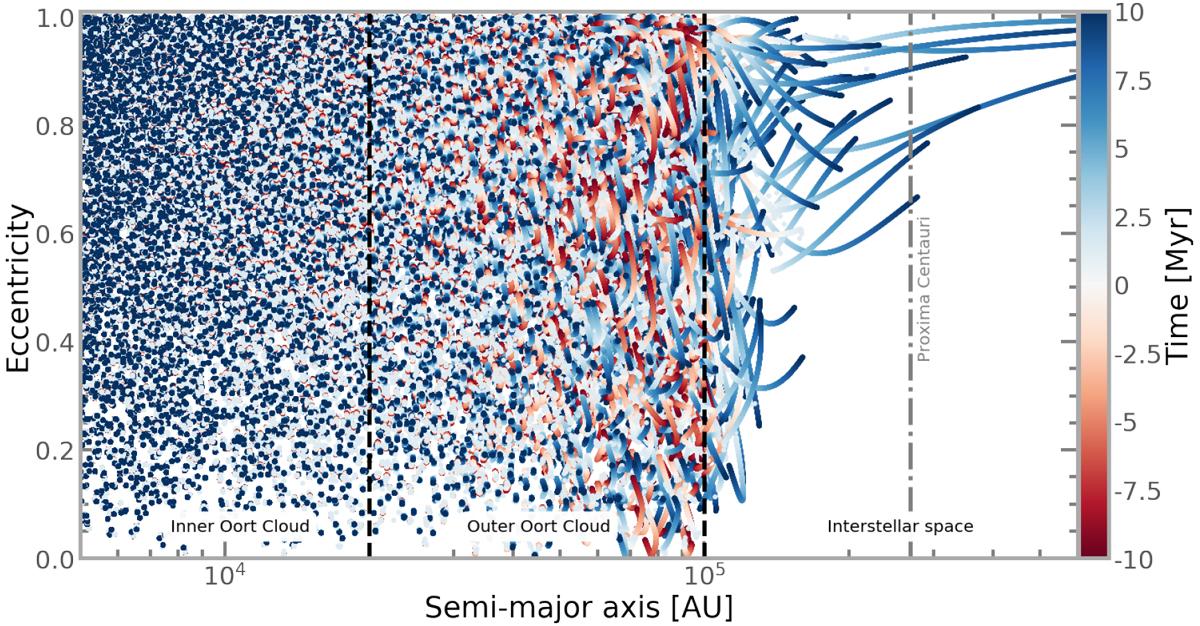
Orbital evolution of the particles in the simulated Oort cloud. The figure shows the evolution of the eccentricity as a function of the semi-major axis over the period of 20 Myr (± 10 Myrs.). The colour bar represents the integration time. An animation can be found online and at https://home.strw.leidenuniv.nl/~storres/#Research.
Current usage metrics show cumulative count of Article Views (full-text article views including HTML views, PDF and ePub downloads, according to the available data) and Abstracts Views on Vision4Press platform.
Data correspond to usage on the plateform after 2015. The current usage metrics is available 48-96 hours after online publication and is updated daily on week days.
Initial download of the metrics may take a while.