Fig. 6
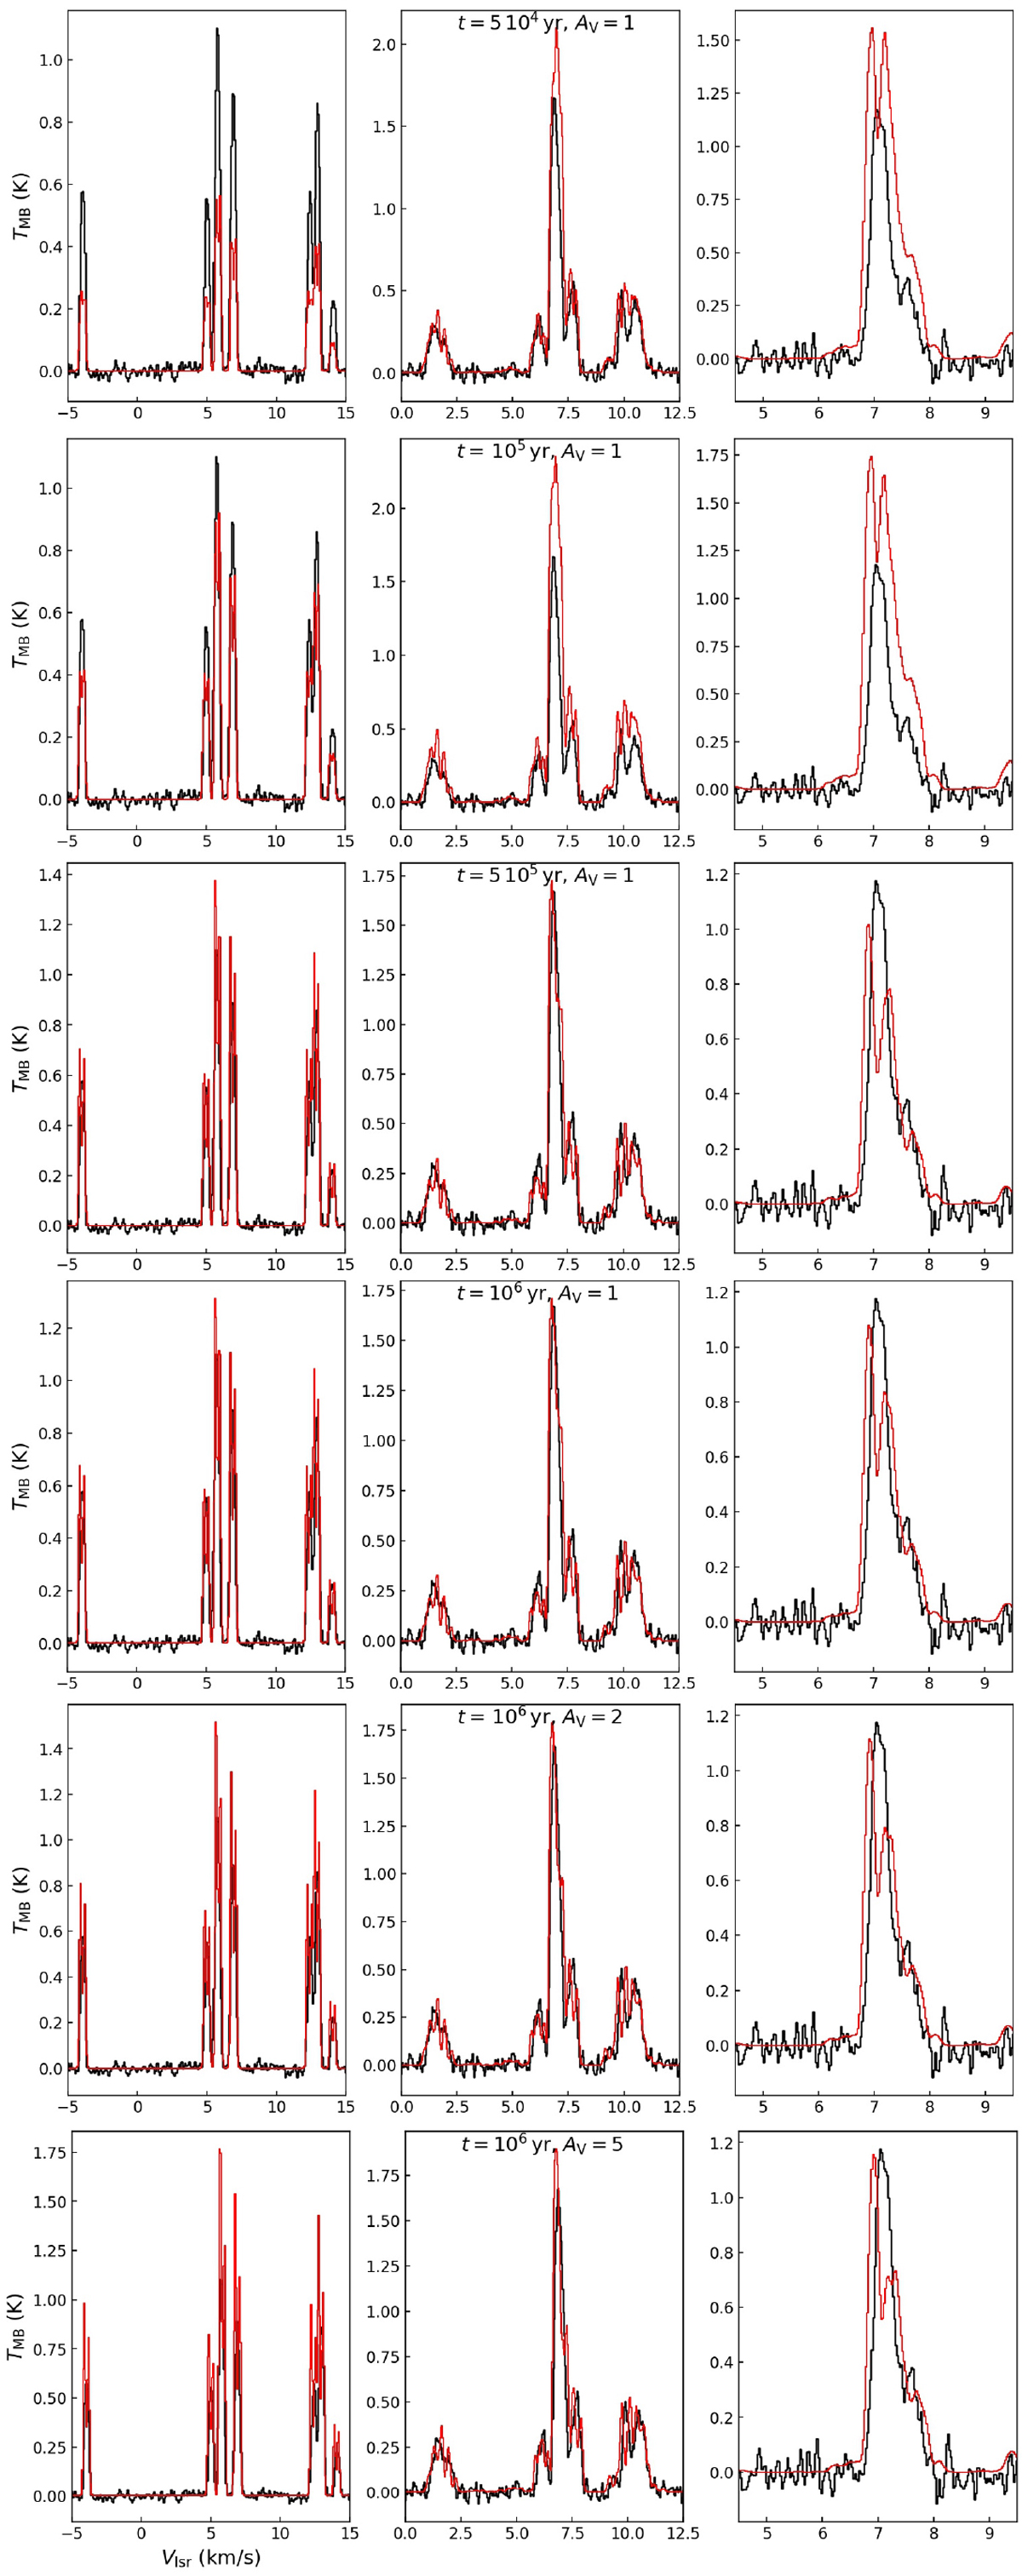
Results of the line radiative transfer for six chemical models on the three transitions of N2D+, respectively (1–0), (2–1), and (3–2) from left to right in each panel. The synthetic spectra are shown with red histograms overlaying the observations (in black). Each model is labelled with its evolutionary stage and external visual extinction.
Current usage metrics show cumulative count of Article Views (full-text article views including HTML views, PDF and ePub downloads, according to the available data) and Abstracts Views on Vision4Press platform.
Data correspond to usage on the plateform after 2015. The current usage metrics is available 48-96 hours after online publication and is updated daily on week days.
Initial download of the metrics may take a while.