Fig. 4
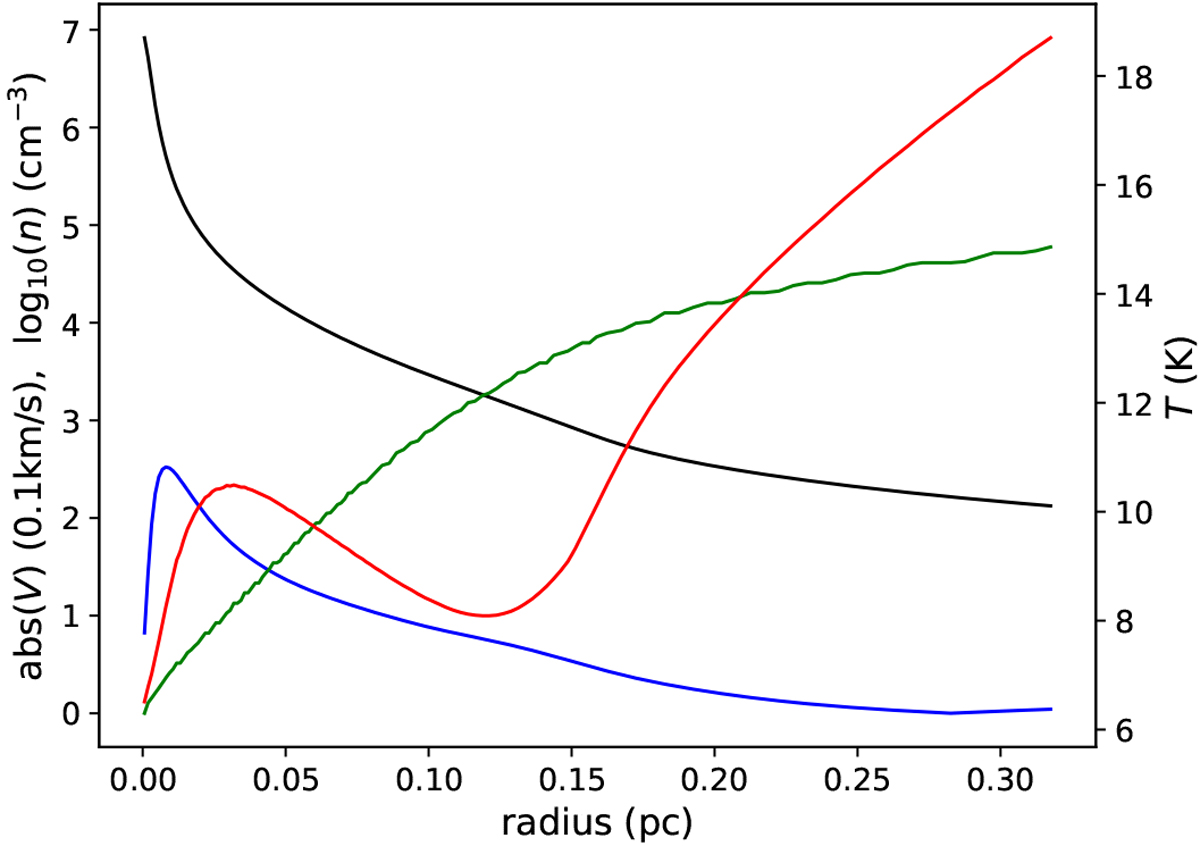
Profiles of dust temperature (green), gas temperature (red), H2 volume density (black, in logarithmic scale), and velocity (blue, in units of 0.1 km s−1) for the L1544 model developed in Keto et al. (2015). The velocity in the model is negative (it represents contraction motions), but it is shown here as positive for improved readability.
Current usage metrics show cumulative count of Article Views (full-text article views including HTML views, PDF and ePub downloads, according to the available data) and Abstracts Views on Vision4Press platform.
Data correspond to usage on the plateform after 2015. The current usage metrics is available 48-96 hours after online publication and is updated daily on week days.
Initial download of the metrics may take a while.