Fig. 3
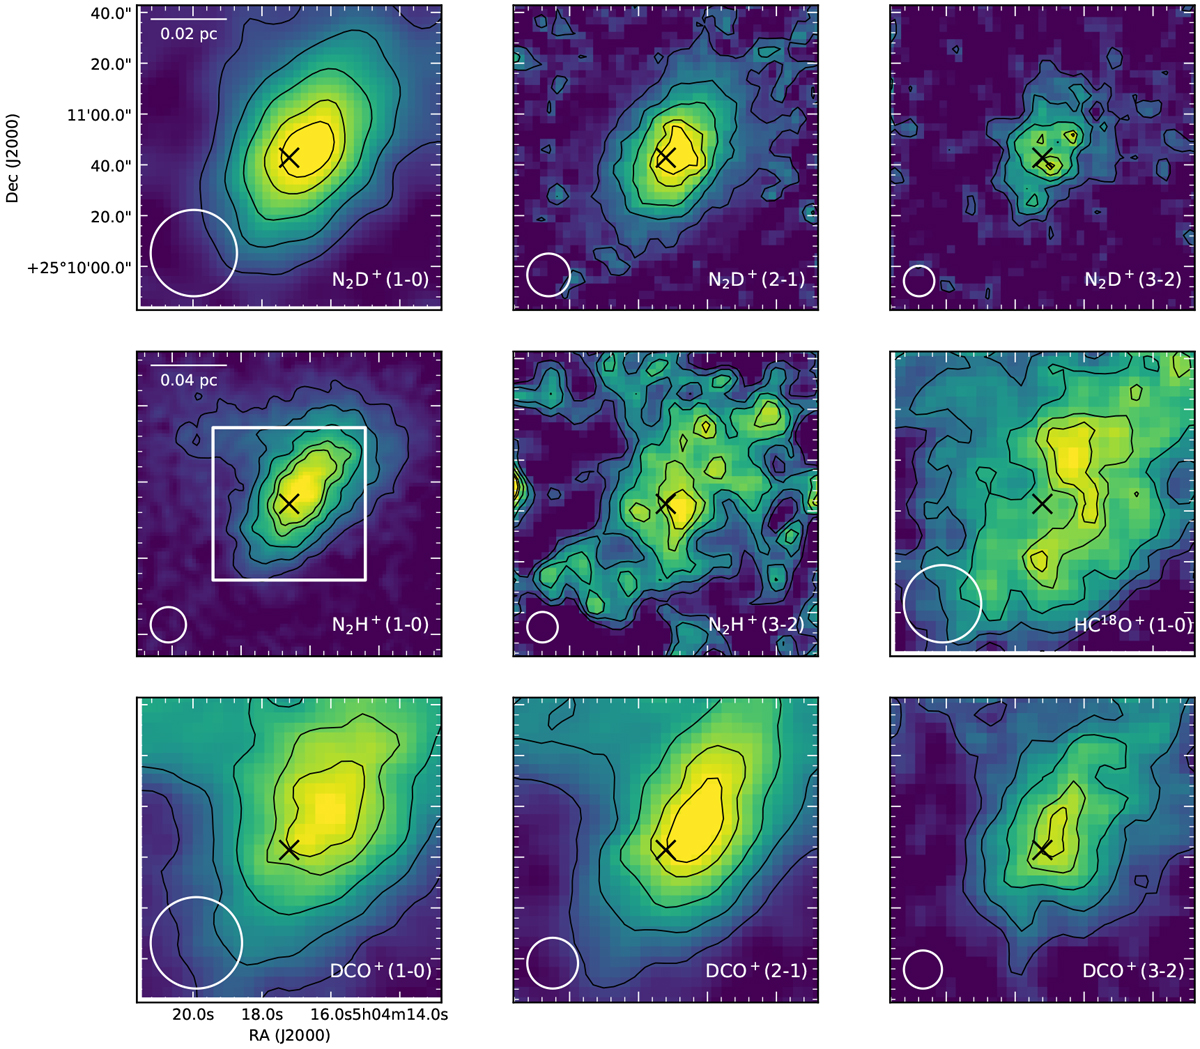
Integrated intensity maps of all the observed transitions, which are labelled in the bottom-right corners. The contours show 20, 40, 60, 80, and 90% of the peak values, which are in order from top left to bottom right panels: 2.0, 2.0, 0.7, 4.6, 0.7, 0.15, 1.8, 1.1, 0.7 K km s−1. The black cross represents the dust peak position, and the white circle is the beam size. All the maps have the same size (2′ × 2′), with the exception of N2H+ (1–0), which is 4′ × 4′: in this map the white rectangle shows the smaller coverage of the other transitions. Scalebars are shown in the top-left corners of the N2D+ (1–0) and N2H+ (1–0) maps.
Current usage metrics show cumulative count of Article Views (full-text article views including HTML views, PDF and ePub downloads, according to the available data) and Abstracts Views on Vision4Press platform.
Data correspond to usage on the plateform after 2015. The current usage metrics is available 48-96 hours after online publication and is updated daily on week days.
Initial download of the metrics may take a while.