Fig. C.1
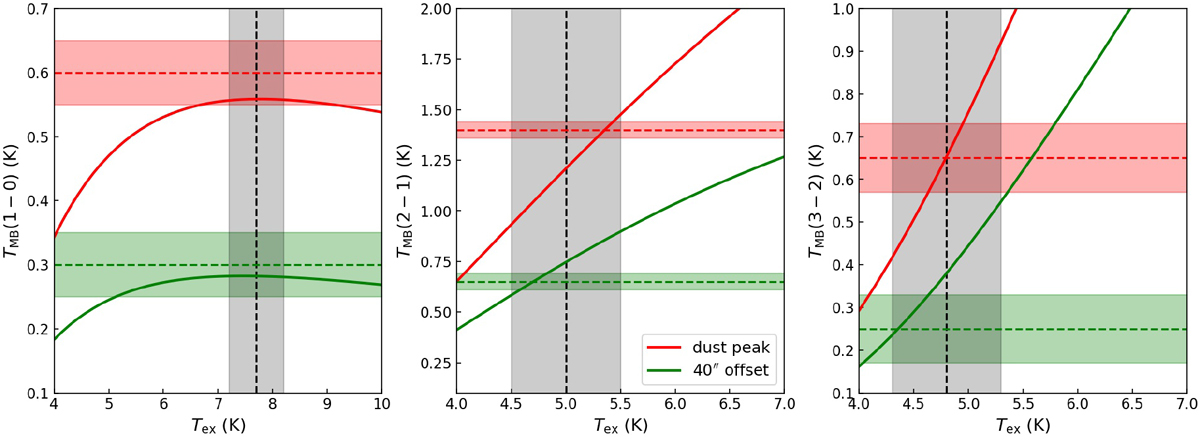
Isolated component of N2D+ (1–0) (left panel), the central component of N2D+ (2–1) (centre), and the N2D+ (3–2) line (right panel). In each panel, the horizontal dashed lines are the observed peak temperatures of the selected N2D+ transition at the dust peak (red), and at 40″ of offset (green). The shadowed areas represent observational uncertainties. The solid curves indicate TMB as a functionof Tex, obtainedvia the radiative transfer equations and using the column density values predicted by MOLLIE at the two offsets. The vertical dashed line is the Tex value used in the analysis of the maps, and the grey shaded area is its uncertainty (0.5 K).
Current usage metrics show cumulative count of Article Views (full-text article views including HTML views, PDF and ePub downloads, according to the available data) and Abstracts Views on Vision4Press platform.
Data correspond to usage on the plateform after 2015. The current usage metrics is available 48-96 hours after online publication and is updated daily on week days.
Initial download of the metrics may take a while.