Open Access
Fig. B.1
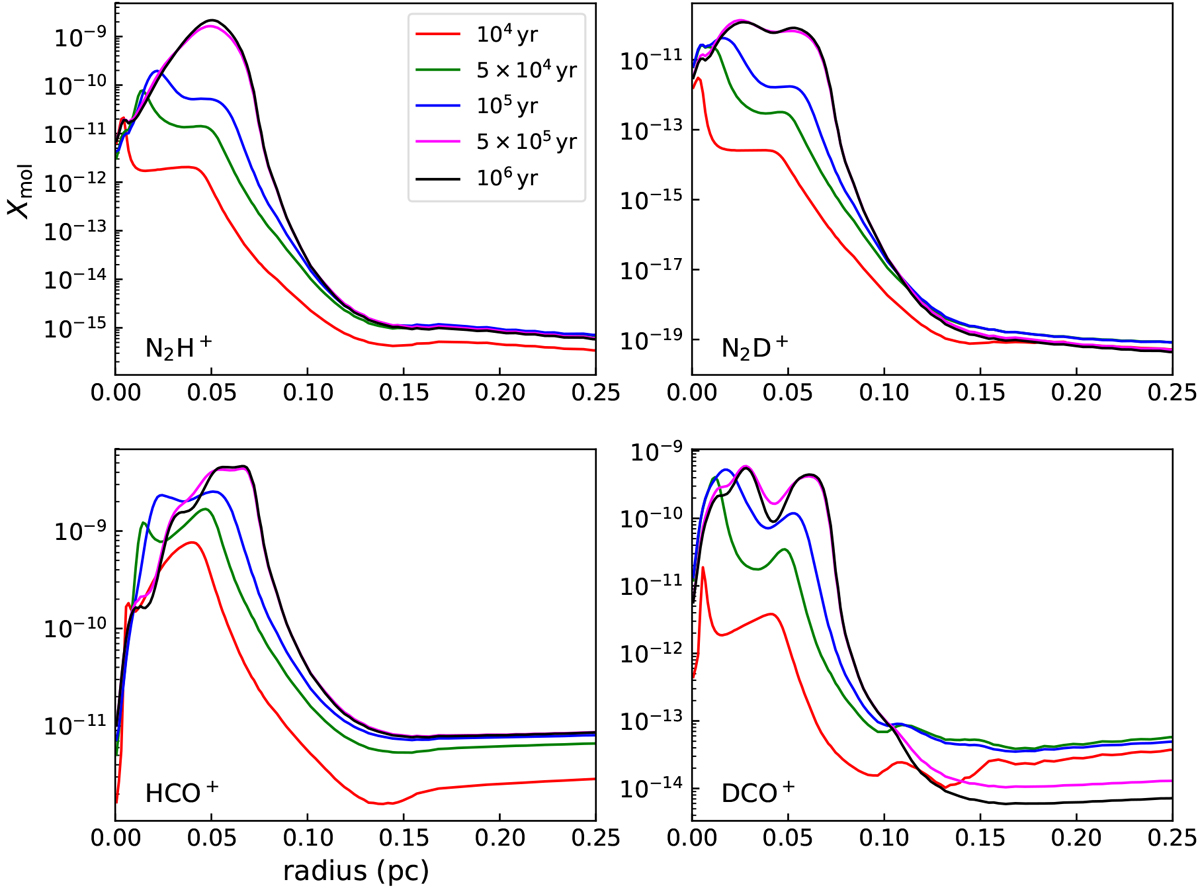
Molecular abundances in the model with AV = 1 mag for N2H+ (top left), N2D+ (top right), HCO+ (bottom left), and DCO+ (bottom right). The colours represent the different time-steps: 104 yr (red), 5 × 10⁴ yr (green), 105 yr (blue), 5 × 10⁵ yr (purple), and 106 yr (black).
Current usage metrics show cumulative count of Article Views (full-text article views including HTML views, PDF and ePub downloads, according to the available data) and Abstracts Views on Vision4Press platform.
Data correspond to usage on the plateform after 2015. The current usage metrics is available 48-96 hours after online publication and is updated daily on week days.
Initial download of the metrics may take a while.