Open Access
Fig. 11
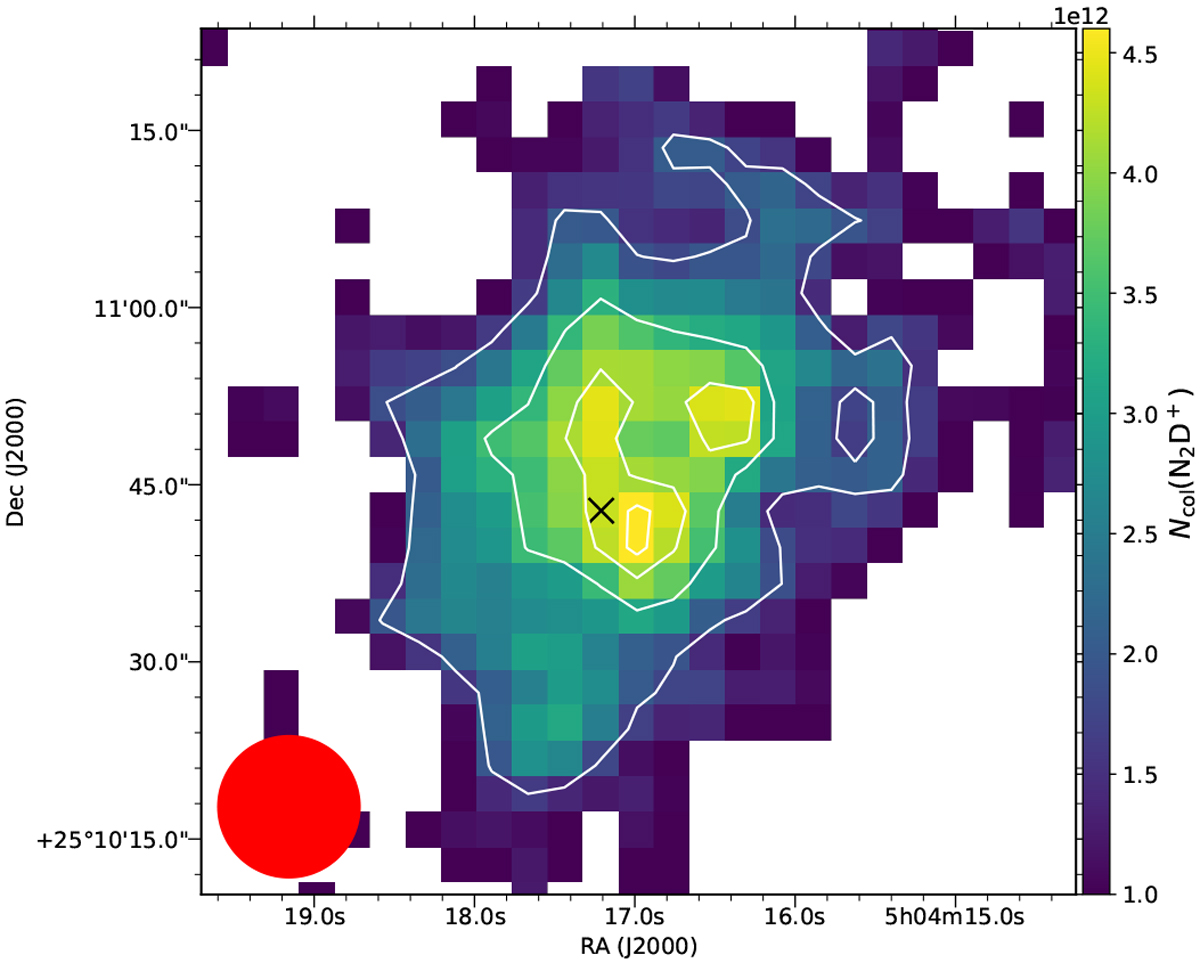
N2D+ column density obtained analysing only the (3–2) transition, thus obtaining a spatial resolution that is almost three times higher with respect to the corresponding panel in Fig. 8. The white contours represent the integrated intensity of the line, at levels of [5, 9, 11, 12]σ (1σ = 0.05 K km s−1).
Current usage metrics show cumulative count of Article Views (full-text article views including HTML views, PDF and ePub downloads, according to the available data) and Abstracts Views on Vision4Press platform.
Data correspond to usage on the plateform after 2015. The current usage metrics is available 48-96 hours after online publication and is updated daily on week days.
Initial download of the metrics may take a while.