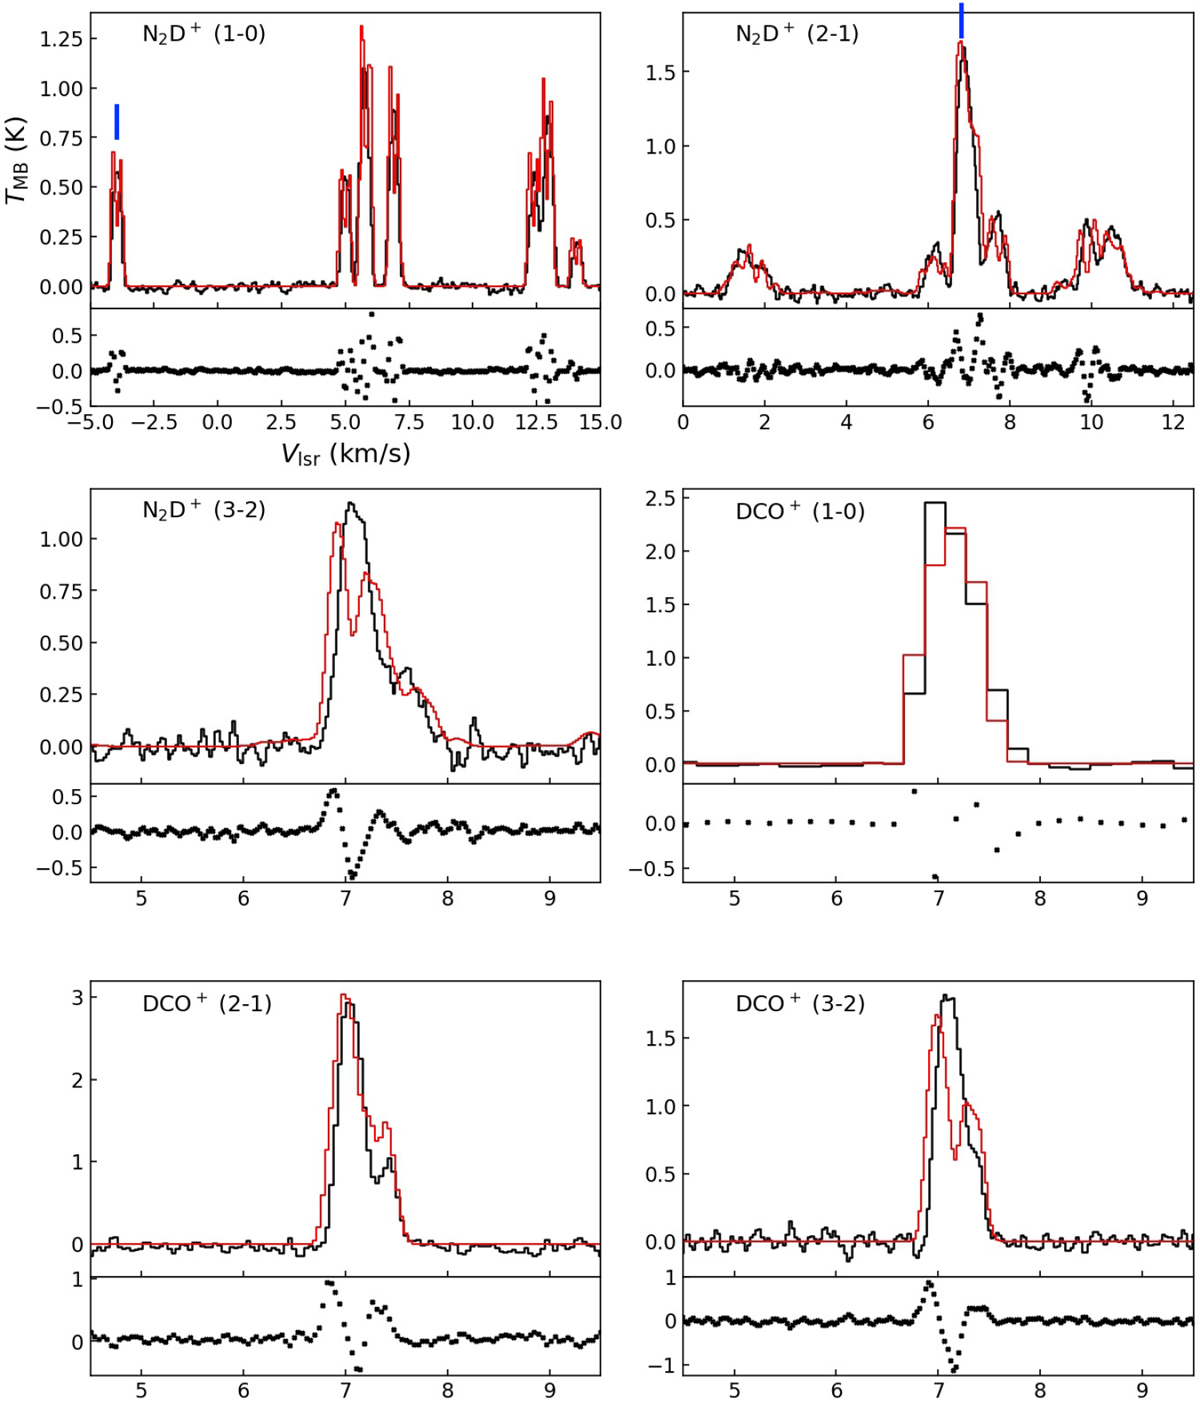
Fig. 1
Observed spectra at the dust peak of N2D+ and DCO+, with the original angular resolution (in black histograms). The transition is labelled in the upper-left corner of each panel. In red, the best-fit solution found with MOLLIE is shown overlaying the observations (see Sect. 3.2). Underneath each line we present the residuals of the fit (difference between the model and the observation). The vertical blue bars show which hyperfine component has been used to derive the molecular column density, when the hyperfine structure has not been neglected.
Current usage metrics show cumulative count of Article Views (full-text article views including HTML views, PDF and ePub downloads, according to the available data) and Abstracts Views on Vision4Press platform.
Data correspond to usage on the plateform after 2015. The current usage metrics is available 48-96 hours after online publication and is updated daily on week days.
Initial download of the metrics may take a while.