Fig. 2
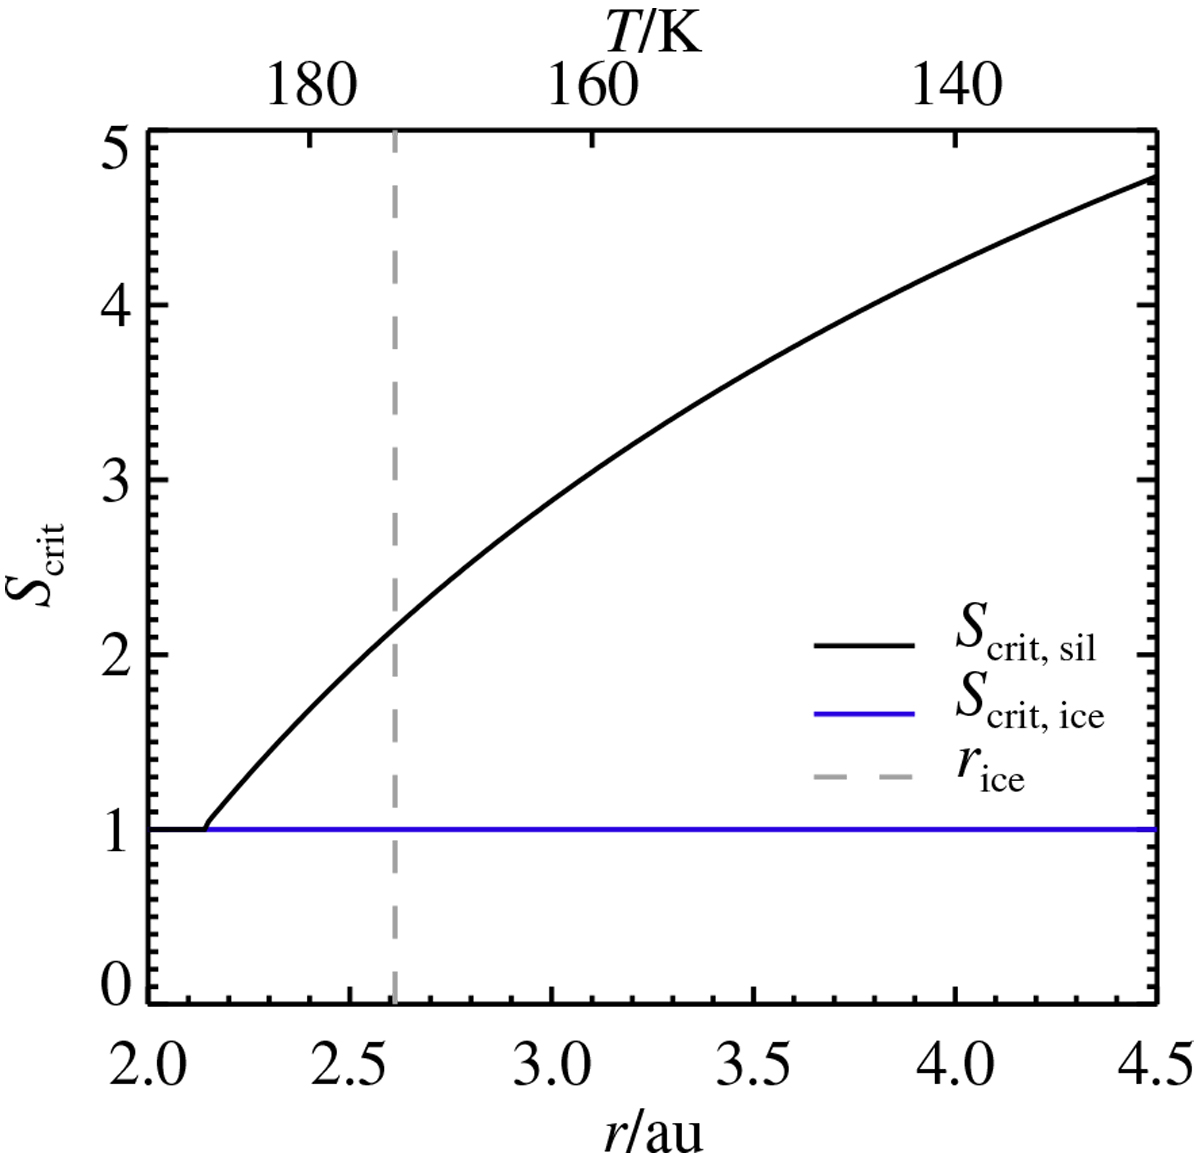
Critical saturation ratio Scrit as a function of semi-major axis for the full extent of our simulations shown for bare silicate particles (heterogeneous ice nucleation) in black and water-ice-covered particles (depositional ice growth) in blue. Also shown is the ice line location, where S = 1, as a grey dashed line. The upper horizontal axis shows corresponding disc temperatures, increasing inwards as
![]() . Critical saturation ratios for silicate in the temperature range 160 ≤ T ≤ 179 are experimental data from Iraci et al. (2010).
. Critical saturation ratios for silicate in the temperature range 160 ≤ T ≤ 179 are experimental data from Iraci et al. (2010).
Current usage metrics show cumulative count of Article Views (full-text article views including HTML views, PDF and ePub downloads, according to the available data) and Abstracts Views on Vision4Press platform.
Data correspond to usage on the plateform after 2015. The current usage metrics is available 48-96 hours after online publication and is updated daily on week days.
Initial download of the metrics may take a while.