Fig. 1
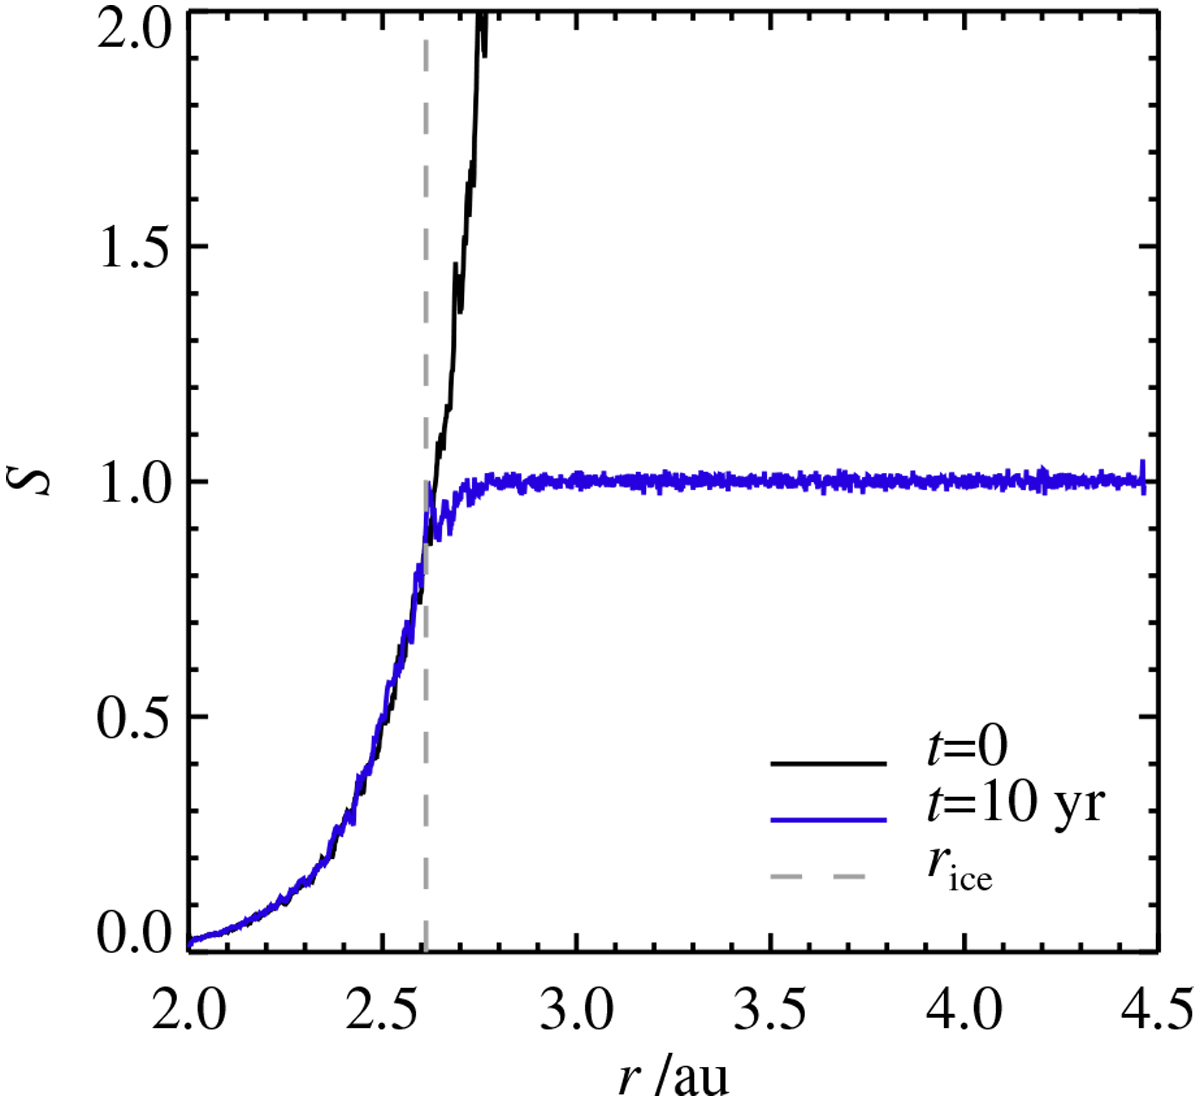
Saturation ratio S = Pv∕Psat for water vapour throughout the simulation region. Black shows the initial saturation ratio and blue shows the state after an equilibrium between vapour and ice has been reached. The ice line location at the start of the simulation, where S reaches unity, is marked by the grey dashed line. Initially, all particles have a thin ice mantle, and the remaining water is distributed throughout the simulation domain as vapour, leading to a steeply rising S. The excess water is quickly deposited on the available solids, so that S ≈ 1 everywhere outside of the ice line, as shown for t = 10 yr.
Current usage metrics show cumulative count of Article Views (full-text article views including HTML views, PDF and ePub downloads, according to the available data) and Abstracts Views on Vision4Press platform.
Data correspond to usage on the plateform after 2015. The current usage metrics is available 48-96 hours after online publication and is updated daily on week days.
Initial download of the metrics may take a while.