Fig. 4.
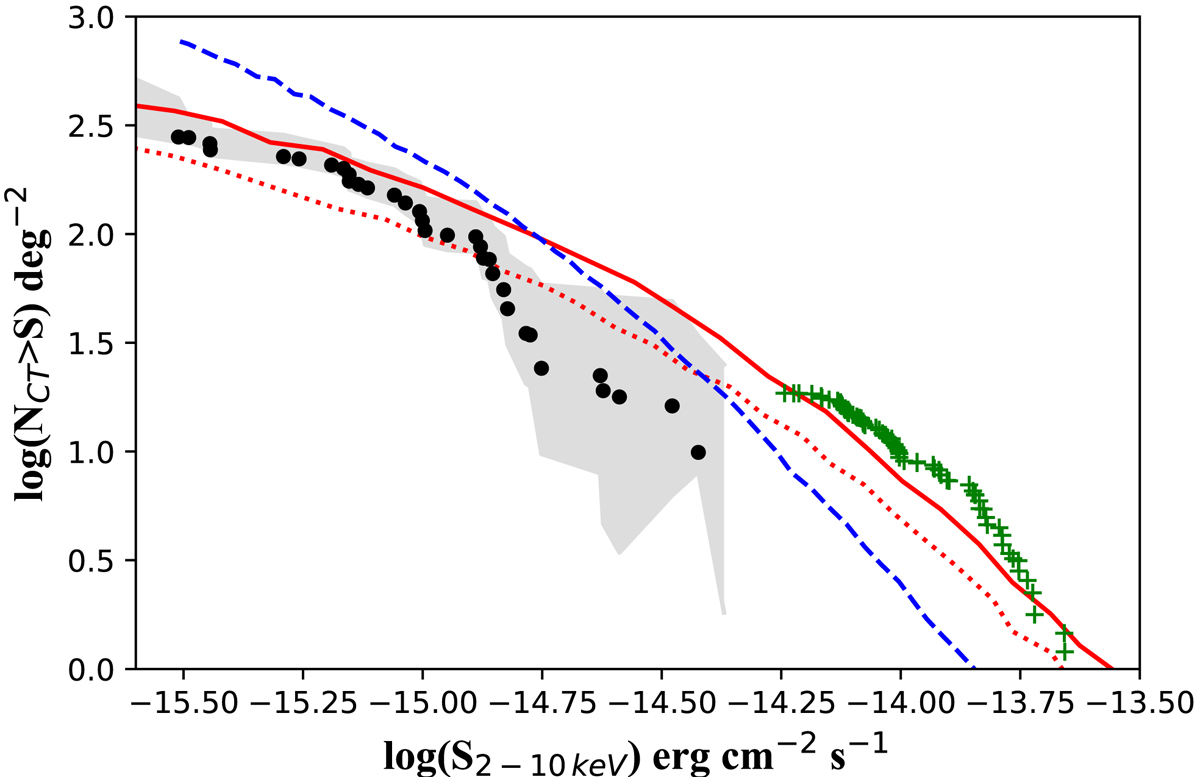
Number count distribution of CT AGN (circles) in CDF-S (this work) and for COSMOS-Legacy data in Lanzuisi et al. (2018) (crosses). Solid and dotted lines correspond to the model predictions presented in Akylas et al. (2012) for a CT fraction of 15% plus 5% reflection, and for a CT fraction of 25%, respectively. The dashed line corresponds to the model in Ueda et al. (2014).
Current usage metrics show cumulative count of Article Views (full-text article views including HTML views, PDF and ePub downloads, according to the available data) and Abstracts Views on Vision4Press platform.
Data correspond to usage on the plateform after 2015. The current usage metrics is available 48-96 hours after online publication and is updated daily on week days.
Initial download of the metrics may take a while.