Fig. 9
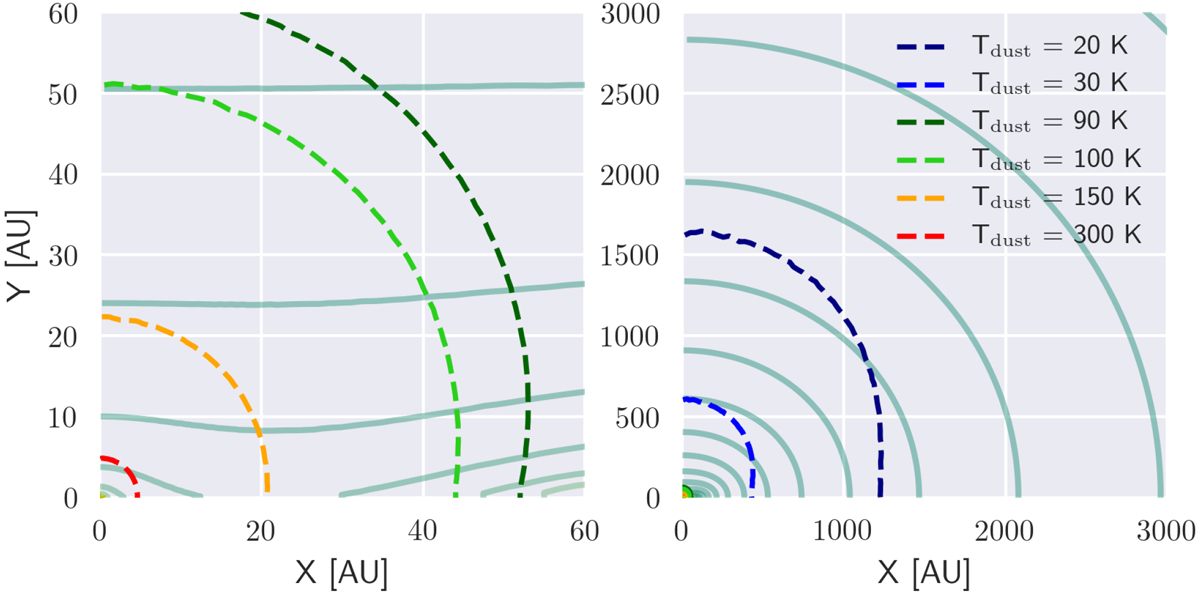
Temperature distribution in the density solution to an infalling-rotating collapse model. The values rc = 60 au, M* = 0.2 M⊙, and Ṁ = 4.05 × 10⁻⁷ M⊙ yr−1 using only coagulated bare-grain opacities, assuming a gas number density of 106 cm−3. The density contours in solid lines are logarithmically spaced, increasing toward the midplane (the x-axis), while the dust temperature contours are shown in dashed lines.
Current usage metrics show cumulative count of Article Views (full-text article views including HTML views, PDF and ePub downloads, according to the available data) and Abstracts Views on Vision4Press platform.
Data correspond to usage on the plateform after 2015. The current usage metrics is available 48-96 hours after online publication and is updated daily on week days.
Initial download of the metrics may take a while.