Fig. 8
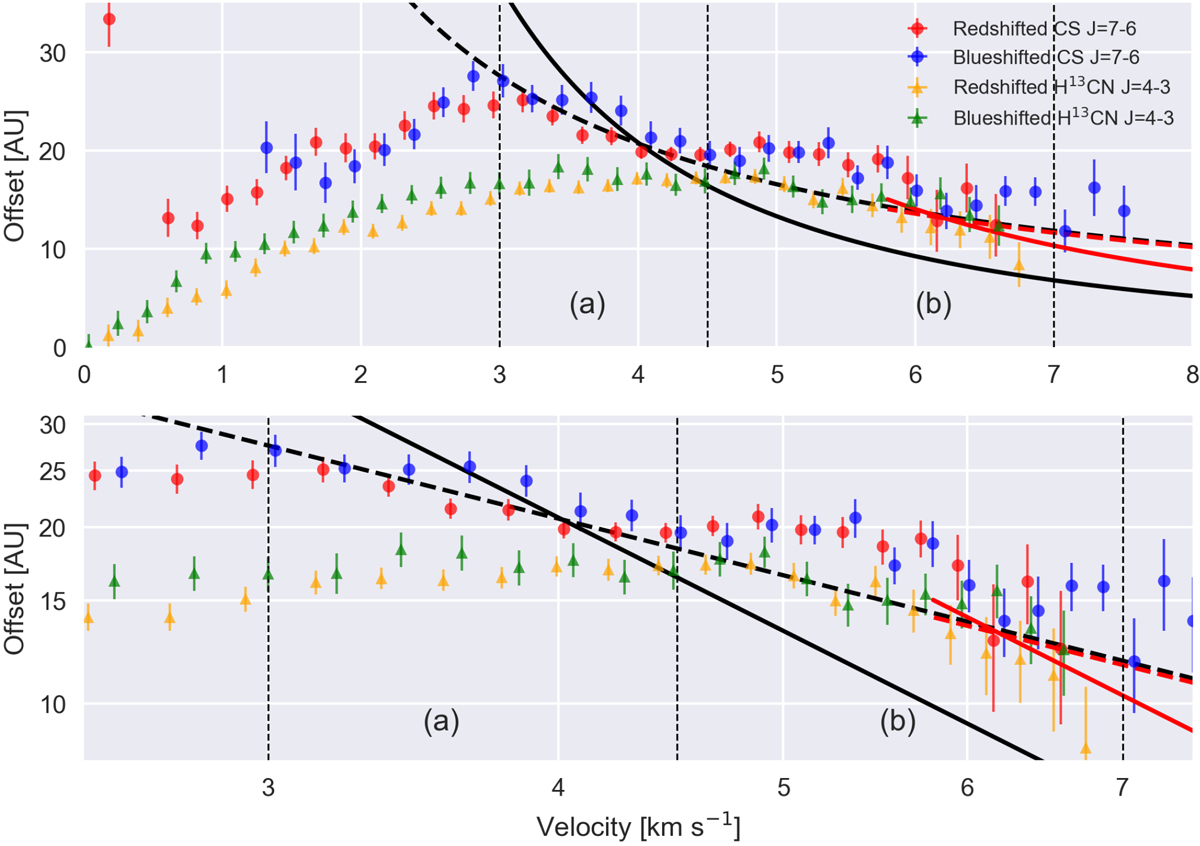
Distance vs. velocity plot of H13CN J = 4–3 and CS J = 7–6 imfit data points, using Cycle 3 data only, in linear scale (top frame) and logscale (bottom frame). The velocities on the first axis are the velocity offset from the employed systemic velocity (6.0 km s−1). The blue- and redshifted imfit data points of the CS J = 7–6 emission are shown in blue and red, respectively, while the blue- and redshifted imfit data points of H13 CN J = 4–3 are shown in green and orange, respectively. The vertical bars of each data point represent the 1σ uncertainty. The (a) and (b) regions, with borders delineated by vertical dashed lines, show which data points were used for the fit. Only CS J = 7–6 data points are used for the fit in velocity region (a), since H13CN J = 4–3 data at velocities below region (b) appear affected by the projected velocities from the emission edge. Only H13 CN J = 4–3 data points are used in velocity region (b), as the CS J = 7–6 emission appear affected by outflows in this region. The data diverging from the model velocity profiles at low velocities, below velocity region (a), arise from the projected rotational gas motions at the edge of the emission region, and are not used in the fit. Some CS J = 7–6 imfit results are lacking for v < 1.25 km s−1 owing to heavy, global absorption at low velocities. Both frames are overlaid with the best-fit infall (black dashed line) and Keplerian velocity profile (black full line) to the Cycle 3 data. The red solid line and the red dashed line show the best fit to the H13 CN J = 4–3 imfit data points with absolute velocities >5.8 km s−1, using a Keplerian and infall velocity profile, respectively.
Current usage metrics show cumulative count of Article Views (full-text article views including HTML views, PDF and ePub downloads, according to the available data) and Abstracts Views on Vision4Press platform.
Data correspond to usage on the plateform after 2015. The current usage metrics is available 48-96 hours after online publication and is updated daily on week days.
Initial download of the metrics may take a while.